
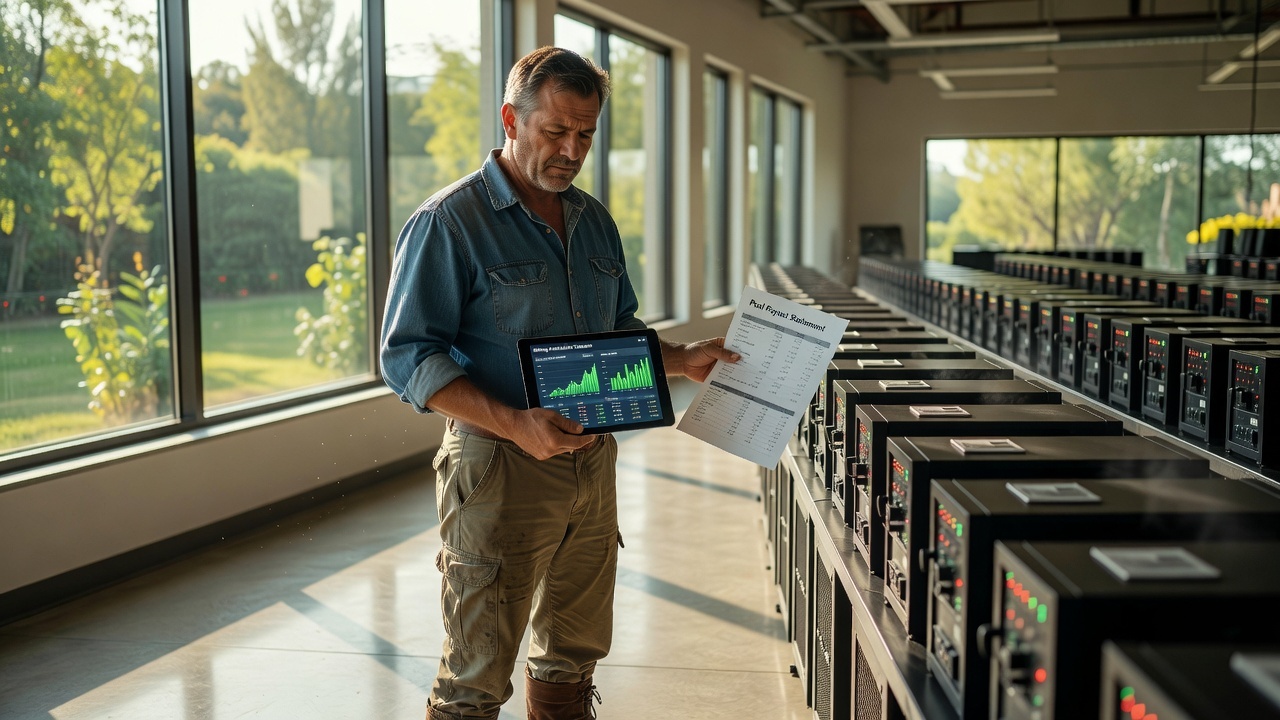
Why did I get less than what the mining calculator showed?
Short:The calculator calculates the ideal day - fixed difficulty, zero stale shares, full uptime and a “showcase” pool commission. The actual payout is almost always 3-10% less than the forecast, and each percentage is broken down into specific layers: payout scheme, real commission, stale shares, downtime, increasing complexity and withdrawal commission. Below is each layer using the example of one ASIC at 200 TH/s.
What commission does the pool actually take?
Most calculators provide a “showcase” commission. Our comparison of commissions with the official documentation of the pools (08/10/2026) showed how much the showcase diverges from reality:
- EMCDadvertises “from 1.5%”, but for BTC the official commission is 4% (1.5% applies to other coins)
- ViaBTCwrites “2%”, but this is the PPLNS rate; default PPS+ costs 4% of block reward plus 2% of transaction fees
- AntPool and Foundry USAhave no public commission at all: Foundry has tariff levels based on hashrate, AntPool has a figure visible only in your personal account
If the calculator took 2%, and the pool actually retains 4%, you will be “missing” 2% before all other losses. Current verified commissions of all 17 pools - inPOOL BTC rating.
Where do transaction fees go?
Block reward = subsidy (3.125 BTC) + transaction fees. The share of commissions varies from fractions of a percent in quiet weeks to double-digit percentages in days of online rush. Classic PPS pays only for the subsidy: the entire commission part remains to the pool. FPPS and PPS+ also distribute commissions. If the calculator calculated the “full” reward, and you are connected to the PPS pool, the discrepancy is equal to the share of transaction commissions for the period. Read more about how to calculate income through hashprice - in the analysishash price is more important than BTC price.
How much do stale shares cost?
Balls sent late are not counted by the pool. The percentage of stale depends on the ping to the pool server and network stability: look at it in the dashboard of your pool, and not on the average for the hospital. The arithmetic is tough: 2% stale = minus 2% income. Choose the nearest stratum region and wired connection.
Downtime you didn't notice
The calculator calculates 24 hours of hashrate. Rebooting the ASIC after freezing, overheating with throttling, minute-long connection interruptions - all this is invisible to the eye, but 1 hour of downtime per day = minus 4.2% of daily income. Compare the “average hashrate for 24 hours” in the pool statistics with the passport one: the difference is your real downtime.
The difficulty increased while you accumulated the threshold
The calculator's forecast is correct at the time of calculation. The difficulty is recalculated every ~2016 blocks (about two weeks) and on the monthly horizon can significantly shift income in any direction. If you have been accumulating the payment threshold for several weeks (check your deadline intime until payment calculator), the actual amount will almost certainly differ from the first day forecast.
Payout threshold and withdrawal fee
Some pools withhold a network commission when withdrawing: for example, Luxor adds a withdrawal commission of 0.000075 BTC to the threshold of 0.001 BTC - this is 7.5% of the minimum payout. On small payouts, the withdrawal commission is a noticeable loss item: it is more profitable to save more than the threshold or choose a pool with free automatic withdrawal (for example, ViaBTC). What is the threshold for which pool and what is more important given your farm size - in the guidewhich pool to choose for your hashrate.
Example: where did the 7% of ASIC at 200 TH/s go?
Simple calculator forecast: 200 TH/s with a network of 800 EH/s = 0.0001125 BTC/day for full reward without commission. The reality of a miner on an FPPS pool with a commission of 4%, 1% stale and 30 minutes of downtime per day:
| Layer | Loss | Remaining BTC/day |
|---|---|---|
| Forecast | - | 0.0001125 |
| Pool commission 4% | -4% | 0.0001080 |
| Stale shares 1% | -1% | 0.0001069 |
| Downtime 30 min/day | -2.1% | 0.0001047 |
| Total | -6.9% | 0.0001047 |
Plus a possible shift in difficulty during the period of threshold accumulation. This is the difference between a forecast and an extract from the pool. Comparison of the largest pools according to real conditions - in the materialAntpool vs Foundry USA vs F2Pool.

How to check your case in 10 minutes
- Take the pool payouts for 7-14 days and compare with the “average hashrate for 24 hours” from the pool statistics (not with the passport)
- Check your scheme's commission against the pool's official documentation - not against a display case or a calculator
- Look at the stale rate in the dashboard. More than 1.5% - change stratum region
- Run your numbers throughPOOL BTC calculator: he calculates using the formula net BTC/day, taking into account the pool commission and electricity
What this analysis does not take into account
“Luck” of PPLNS pools in a short window, merged mining and bonus tokens, change in the BTC rate at the time of sale. All figures are estimates and not guarantees of income.
Frequently asked questions
How far does the calculator's forecast usually differ from the actual payout?
With good equipment and an honest pool, the discrepancy is usually 3-10%: pool commission (2-4%), stale shares (0.5-2%), minor downtime (1-3%) and difficulty shift. If the difference is consistently greater, check the scheme’s commission and uptime.
Is the calculator lying or is the pool cheating?
Most often, it is neither one nor the other: the calculator calculates ideal conditions, and the pool retains the commission of its scheme, which may differ from the storefront one. Check the rate of your scheme in the official documentation of the pool and recalculate it.
Which payout scheme is closest to the calculator's prediction?
FPPS: It pays both the subsidy and a share of transaction fees at a flat rate, so the daily income is stable. PPLNS is more volatile in the short term, but with a lower commission (for example, 2% versus 4%) it can give more over the long term.
How to reduce the gap between forecast and fact?
Four levers: a pool with an honestly documented commission, the nearest stratum region (less stale), stable power and cooling (less downtime), and recalculation of the forecast after each difficulty recalculation.
This article contains referral links to mining pools (marked as sponsored). We may receive a reward if you register through them. This does not change the figures or the order of rows in the tables: the terms are taken from the pools' official pages.