
ASIC Profitability Ranking, August 2026: which models earn and which run at a loss
On the August 2026 network snapshot, one terahash pays roughly $0.0307 per day after a 2% pool fee. Everything after that comes down to machine efficiency and the price of a kilowatt.
- At $0.05 per kWh nearly the whole current fleet is positive, from the Antminer S21 XP at +$3.91 a day down to the Avalon A1366, which barely clears zero.
- At $0.08 only two of fifteen models stay positive: the S21 XP and the S21 Pro. Everything else goes red, the plain S21 included.
- At $0.12 all fifteen models lose money. Break-even at that tariff sits at 10.65 W per terahash, and the most efficient production model in our database runs at 13.5.
- Switching pools does not close that gap. Fee spreads move cents; tariff spreads move dollars.
Live per-model numbers, with your own tariff plugged in, live in the ASIC profitability ranking.
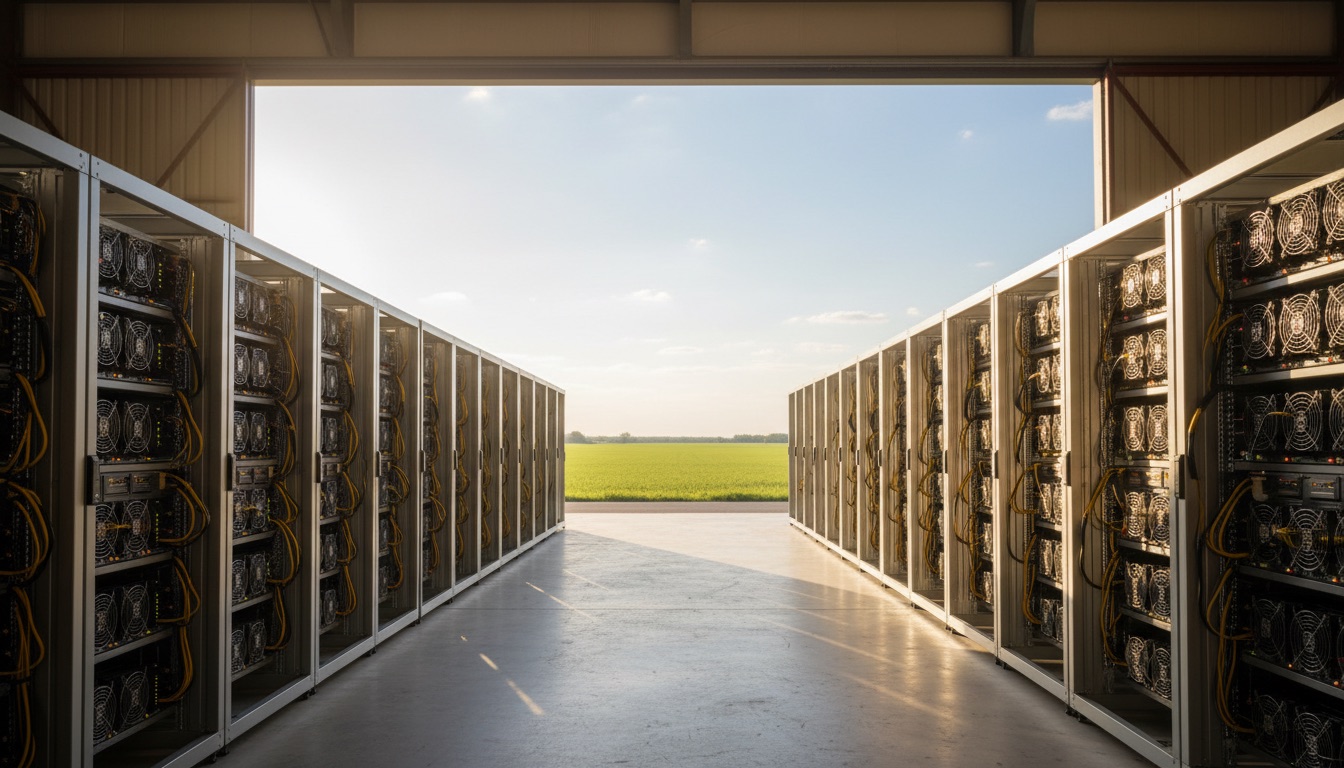
[IMAGE: photorealistic daytime shot, a row of ASIC miners in a bright hall with the roll-up door open, green field and blue sky beyond, sunlight across the racks]
The method, and why there are no payback periods here
One short formula. Daily revenue:
```
revenue = hashrate_TH x rate_per_TH
rate_per_TH = $0.030687 per day
```
The rate comes from the network snapshot detailed in what 100 TH/s actually pays per day: 100 TH/s in a 2% pool returns $3.07 a day at 933.99 EH/s network hashrate, a 3.125 BTC block subsidy and a BTC price of 64,558 USD as of 14 August 2026. Divide by 100 and you have the per terahash rate. No model has its own special yield. The chain pays for a share of network hashrate, and the machine only decides how many terahashes you contribute and how much the utility bills you for them.
Electricity:
```
kWh per day = hashrate_TH x W_per_TH x 0.024
cost = kWh per day x tariff
net = revenue - cost
```
The TH/s and W/TH values come from the dataset behind the ASIC profitability ranking. These are manufacturer spec numbers, no overclock and no undervolt applied.
What you will not find here: hardware prices and payback periods. New and used ASIC prices differ by a multiple between marketplaces and move every month, so any number printed here would be invented. Payback is worth calculating against one specific seller's offer, which is what the mining profitability calculator is for.
Which ASIC earns the most per day
The Antminer S21 XP earns the most: 270 TH/s at 13.5 W/TH produces $8.29 gross and $3.91 net at $0.05 per kWh. At $0.08 it keeps $1.29, and at $0.12 it drops to minus $2.21. The S21 Pro comes second. Absolute revenue tracks hashrate, but survival under expensive power tracks efficiency and nothing else.
Top 10 models by net income
Sorted by the $0.05 column. Gross means revenue after a 2% pool fee, before electricity.
| Model | TH/s | W/TH | Gross $/day | $0.05 | $0.08 | $0.12 |
|---|---|---|---|---|---|---|
| Antminer S21 XP | 270 | 13.5 | 8.29 | +3.91 | +1.29 | −2.21 |
| Antminer S21 Pro | 234 | 15.0 | 7.18 | +2.97 | +0.44 | −2.93 |
| Antminer S21 | 200 | 17.5 | 6.14 | +1.94 | −0.58 | −3.94 |
| WhatsMiner M60S | 186 | 18.5 | 5.71 | +1.58 | −0.90 | −4.20 |
| Avalon A1566 | 185 | 18.5 | 5.68 | +1.57 | −0.89 | −4.18 |
| Antminer T21 | 190 | 19.0 | 5.83 | +1.50 | −1.10 | −4.57 |
| Avalon A1466I | 170 | 19.5 | 5.22 | +1.24 | −1.15 | −4.33 |
| WhatsMiner M60 | 172 | 19.9 | 5.28 | +1.17 | −1.29 | −4.58 |
| WhatsMiner M56S++ | 230 | 22.0 | 7.06 | +0.99 | −2.66 | −7.51 |
| WhatsMiner M50S++ | 160 | 22.0 | 4.91 | +0.69 | −1.85 | −5.23 |
Look at the M56S++. On gross revenue it ranks third at $7.06 a day, right behind the two flagship Antminers. On net at $0.05 it ranks ninth, and at $0.08 it loses to machines with half its hashrate. That is the whole difference between powerful and profitable.
Who is losing money, and at which tariff
Break-even is one line: `W/TH <= rate / (0.024 x tariff)`. At $0.05 that ceiling is 25.57 W/TH, at $0.08 it is 15.98, and at $0.12 it is 10.65. Anything above the ceiling loses money regardless of its hashrate or its pool.
| Model | TH/s | W/TH | $0.05 | $0.08 | $0.12 |
|---|---|---|---|---|---|
| Antminer S19 XP | 141 | 21.5 | +0.69 | −1.49 | −4.40 |
| Avalon A1366 | 130 | 25.0 | +0.09 | −2.25 | −5.37 |
| WhatsMiner M53 | 226 | 29.0 | −0.93 | −5.65 | −11.94 |
| Antminer S19j Pro | 104 | 29.5 | −0.49 | −2.70 | −5.64 |
| iPollo B2 | 110 | 29.5 | −0.52 | −2.85 | −5.97 |
Three models bleed even at $0.05 per kWh: the M53, the S19j Pro and the iPollo B2. That is the 29 W/TH generation, and there is no residential tariff today at which it covers its own draw. The Avalon A1366 clears nine cents a day at $0.05, which is positive in arithmetic and noise in practice. One replacement fan wipes out a month of it.
The S19j Pro deserves its own paragraph. It still sells in volume on the secondary market as the sensible home rig, and at spec 104 TH/s it grosses $3.19 a day. Power at $0.05 costs $3.68. The gap is 49 cents a day, roughly $180 a year per machine, and that is before the purchase price enters the picture.
Why a quarter of the installed fleet ended up underwater, and how to check your own firmware numbers against it, is covered in nearly one in four ASIC models is losing money.
How to track ASIC profitability daily
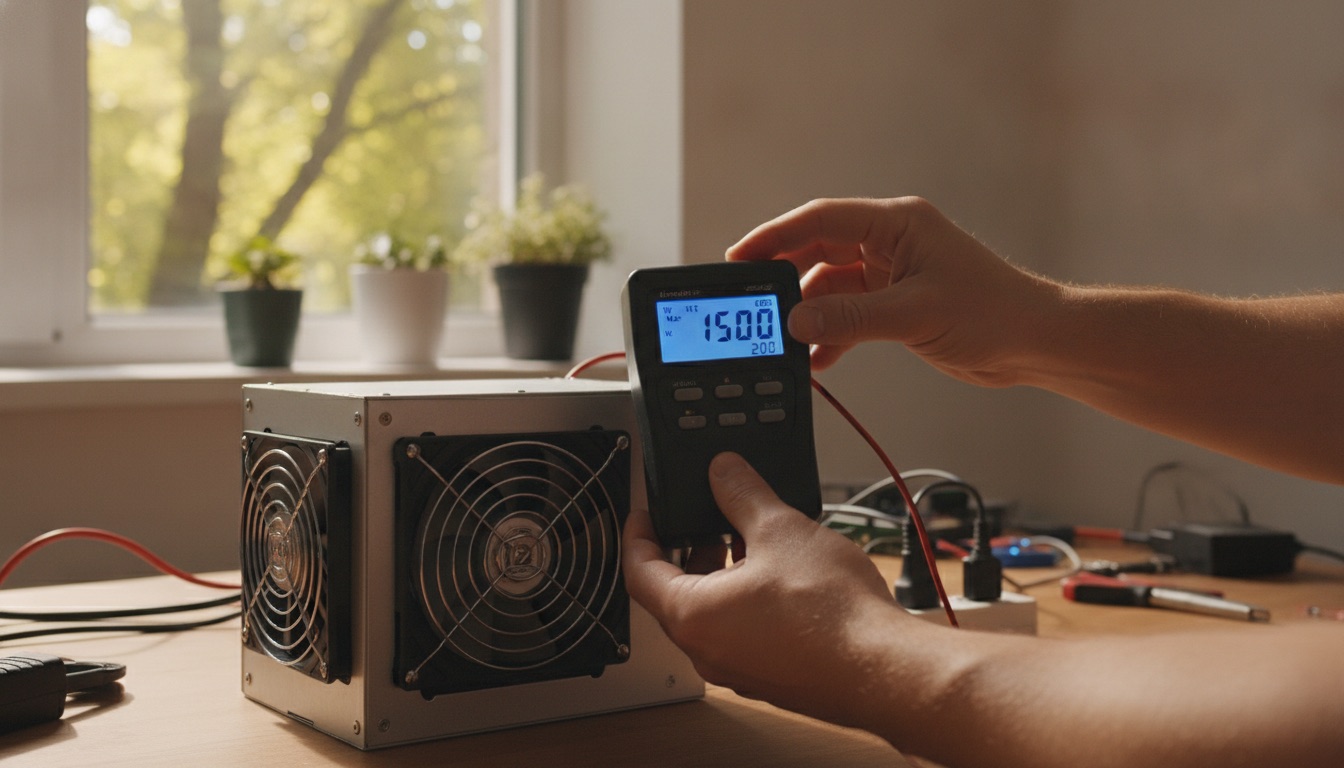
Daily tracking is three numbers: the current per terahash rate from the network snapshot, your machine's measured W/TH at the wall, and yesterday's tariff. The first updates in the ASIC profitability ranking, the second comes off a wattmeter, the third you already know. The recalculation takes a minute.
Three mistakes that make daily tracking lie:
- Spec watts instead of wall watts. Air-cooled ASICs draw more than the sticker once they are warm and the room is hot. Measure, do not trust the label.
- Yesterday's per terahash rate. Difficulty retargets every 2016 blocks and the price moves daily. A week-old rate carries an error comparable to your entire margin under an expensive tariff.
- A single day instead of a rolling window. PPLNS pools, and solo mining far more so, swing hard day to day. Read the 7 day average.
Why payouts drift down even when your farm's hashrate never changes is explained in why your mining reward keeps dropping every day.
[IMAGE: photorealistic close-up, hands holding a wattmeter next to a running ASIC, bright room, green trees and daylight through the window]
Is it worth switching pools for profitability
Almost never. The gap between a 1% pool and a 4% pool on 100 TH/s is nine cents a day, while the gap between $0.05 and $0.12 per kWh on the same hardware is $2.02. Switch pools over payout thresholds, stratum stability and payout scheme, not over the fee percentage. The full comparison with numbers is in the August 2026 pool comparison.
What to do if you own older hardware
Three options, all of them settled by the same formula. Cut your effective cost per kilowatt, meaning move the machine somewhere the tariff falls under your model's ceiling. Undervolt, which trades hashrate for W/TH and only wins when consumption drops by a larger percentage than hashrate does. Or sell it and stop being sentimental. A 29 W/TH machine at $0.08 loses money every hour it spins.
One seasonal note. In summer an air-cooled ASIC in a hot room draws above spec because the fans run harder. In winter, if the exhaust heats the house, part of the power bill honestly belongs to the heating budget, which pushes your model's real break-even tariff below the table value. How much credit you get depends on what you would otherwise be heating with.
FAQ
Which ASIC is the most profitable in August 2026?
By absolute income, the Antminer S21 XP: 270 TH/s at 13.5 W/TH, $8.29 gross and $3.91 net at a $0.05 tariff. At $0.08 it is the only model with real headroom left, keeping $1.29 a day. At $0.12 no model in our dataset is positive.
Is a bigger machine better when power is expensive?
No, the opposite. Under an expensive tariff W/TH decides everything and TH/s decides nothing. The 230 TH/s WhatsMiner M56S++ loses $2.66 a day at $0.08, while the 170 TH/s Avalon A1466I loses $1.15. A powerful inefficient machine simply burns cash faster.
Why are there no payback periods in this article?
Because payback cannot be computed without a hardware price, and new and used ASIC prices vary by a multiple across marketplaces and shift monthly. Put a real seller's price and your own tariff into the mining profitability calculator for an honest answer instead of an averaged one.
How often should these numbers be recalculated?
Every two weeks at minimum, which is roughly every difficulty retarget. After a sharp move in price or tariff, recalculate the same day. The table above is an August 2026 snapshot and it expires along with the network parameters behind it.
Where to go next
Current per-model numbers with your own tariff: ASIC profitability ranking. A calculation against a specific machine and purchase price: mining profitability calculator. Pool comparison by net income: article 97.