
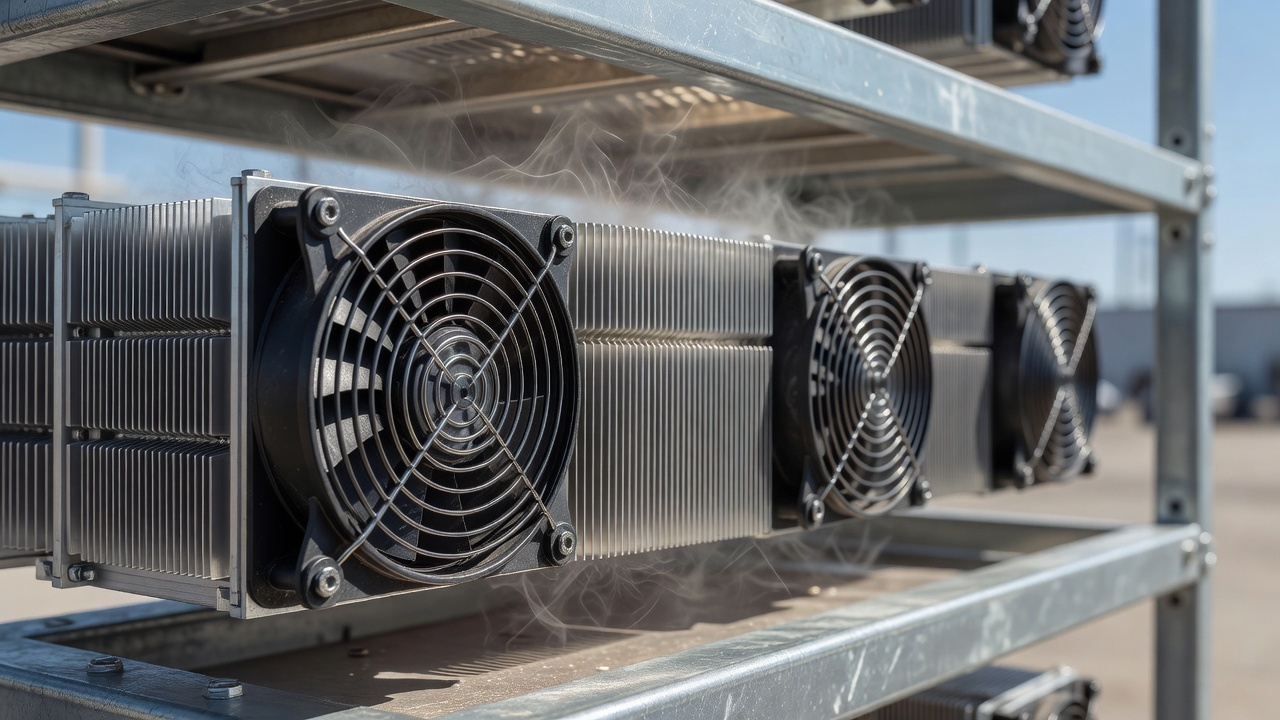
Nearly One in Four ASIC Models Is Losing Money Right Now: How to Check Your Own Rig
WuBlockchain Data Center reported on August 6, 2026 that 22.7% of the 22 ASIC miner models it tracks post a negative daily return once electricity costs are factored in. That is not a forecast. It is the state of the market today: roughly one out of every four models still marketed as current-generation hardware is burning its owner's money every single day it runs.
Source: blockchainreporter.net
The shutdown price, and why $46,787 is not a universal number
WuBlockchain puts the shutdown price, the BTC price at which even the most efficient machines on the market break even, at $46,787. That number is a floor for the top-efficiency class of hardware. Older generations of ASIC sit above it, sometimes far above it: the more joules a machine burns per terahash, the sooner it flips negative when the BTC price drops or the electricity bill goes up.
Which means there is no single breakeven price for "mining." Every model has its own shutdown price, and it moves with three variables. You control at least two of them: your hardware's efficiency, your electricity rate, and how much a pool takes off the top.
The three numbers that decide whether you're in the green
1. Efficiency in J/TH
This is the spec sheet number: how many joules a machine spends per terahash of computation. Lower is better. The Hashrate Index weekly roundup (data from August 3, 2026) shows how much that one number moves your revenue per unit of power consumed:
| Efficiency class | Revenue per MWh consumed |
|---|---|
| under 14 J/TH | $109/MWh |
| 14-19 J/TH | $79/MWh |
| 19-25 J/TH | $60/MWh |
| 25-38 J/TH | $41/MWh |
The gap between the best and worst efficiency class here is close to 2.7x. A machine in the 25-38 J/TH bracket earns a fraction of what a sub-14 J/TH ASIC pulls in per megawatt-hour, at the exact same BTC price. These figures are from early August 2026 and shift daily along with BTC price, network difficulty and fee revenue in blocks, but the underlying relationship, efficiency drives revenue per MWh, does not change from week to week.
2. Your electricity rate
Take your real rate in $/kWh and multiply by 1,000 to get $/MWh. If that figure is higher than the revenue-per-MWh number for your efficiency class above, the machine is losing money at the most basic level: power costs alone exceed mining revenue, before you even subtract pool fees, hardware depreciation, or hosting.
3. Pool fees and the payout scheme
This is where a comparison site like POOL BTC actually earns its keep. A pool fee eats into revenue before it reaches your wallet, and the payout scheme decides how predictably you get paid.
Under FPPS, a pool pays a fixed rate per accepted share plus a share of transaction fees found in blocks. Income is steady and easy to model: you can plug your efficiency-based revenue per MWh straight into the math, subtract the pool fee, and compare against your electricity rate.
Under PPLNS and similar schemes, income tracks the pool's luck over a given window. Averaged over a full month the numbers tend to converge with FPPS, but a miner who is already sitting close to the shutdown price can get pushed into a real, sustained loss by a bad-luck stretch that lasts a few days or weeks. The closer a rig sits to its breakeven line, the more that payout unpredictability actually costs.
You can see the FPPS versus PPLNS gap laid out with numbers and charts in the FPPS vs PPLNS calculator and in a dedicated breakdown of mining pool payout schemes. Current fees and the payout model each pool actually runs are listed in the bitcoin mining pool ranking.
A five-step breakeven check for one specific machine
- Pull the ASIC's efficiency in J/TH from its spec sheet.
- Match it to a bracket in the table above and read off the rough revenue per MWh, keeping in mind that these are early-August 2026 numbers, not today's.
- Convert your electricity rate to $/MWh.
- Subtract your pool's fee percentage from the revenue-per-MWh figure.
- Compare the result to your electricity rate. If post-fee revenue is below your power cost, the machine is already losing money or sitting right on the edge.
The same math applied to one specific ASIC model and its payback timeline is worked through in the ASIC miner payback period article. If your power rate floats or you're comparing sites with different energy prices, the mining electricity cost guide walks through that separately.
Why rising network hashrate makes this worse, not better
The same Hashrate Index roundup put the network's 7-day moving average hashrate at 932 EH/s in early August 2026, up 6.2% for the week. Rising network hashrate means rising difficulty: the same machine at the same BTC price earns fewer blocks and less fee revenue per unit of its own hashrate, because its slice of the total network keeps shrinking.
That's a big part of why the share of unprofitable models in the WuBlockchain report isn't fixed. Even with BTC price unchanged, a growing network hashrate steadily pushes more models past the breakeven line, starting with the oldest and least efficient ones.
When to shut old hardware down, and when to switch pools instead
These are two different problems, and they need two different fixes.
A hardware efficiency problem. If your model falls in the 25-38 J/TH bracket or worse, and your electricity rate is average or high, no pool switch will pull the machine back into profit. Pool fees run a few percentage points of revenue at most, while the gap between efficiency classes in the table above is close to threefold. In that case the question isn't which pool to mine on, it's whether this specific machine is worth running at all, or whether it's cheaper to power it down or sell it.
A fee or payout scheme problem. If the hardware is current-generation (under 19 J/TH) and your electricity rate isn't extreme, but the numbers still come out close to zero, look hard at what the pool charges and how it pays out. On a thin margin, a couple of percentage points of fee, or a switch from volatile PPLNS to predictable FPPS, can be exactly the difference between red and black. Check a few pools side by side in the POOL BTC pool comparison and run the real numbers in the payout calculator before touching the hardware itself.
Either way, it helps to keep a current read on fleet-wide profitability rather than eyeballing the BTC price alone. A short primer on how hashprice is calculated and why it's the better number to track is in the hashprice mining guide.
Bottom line
Almost a quarter of tracked ASIC models are already mining at a loss at current electricity prices, and that share is likely to keep growing alongside network hashrate unless BTC price outruns difficulty. Before reacting, or before shrugging the number off, run your own hardware through the same three variables: efficiency in J/TH, your real electricity rate, and what the pool actually keeps after fees and payout scheme. For old, inefficient rigs, there's usually one honest answer: turn them off. For newer machines sitting right on the line, recalculating what a different pool would pay is often enough before writing the hardware off.