
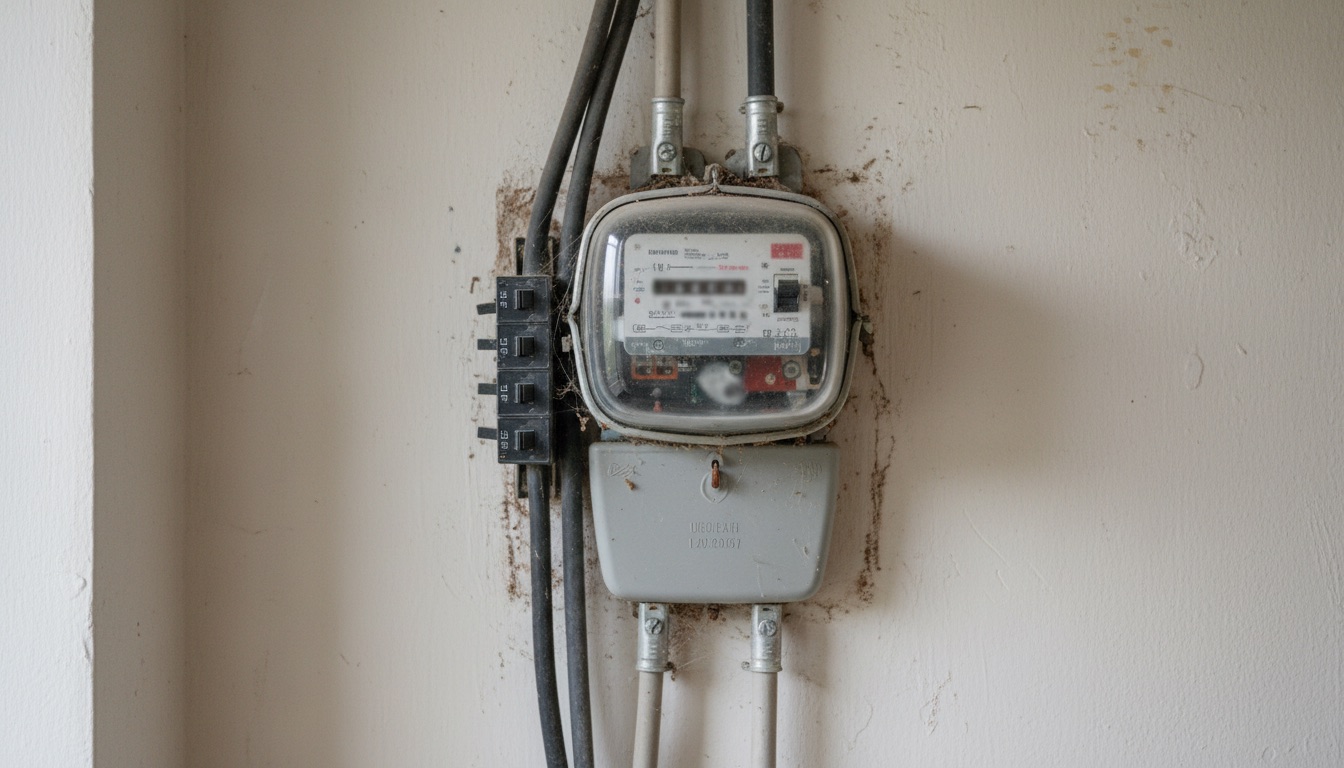
Mining electricity cost: how to find your real $/kWh and the ceiling where the hardware stops earning
*Last updated: 02.09.2026. Written by the POOL BTC editorial team.*
POOL BTC does not accept hashrate and does not pay anyone a reward. It is a comparison site for pools, calculators and mining services, and this article is about somebody else's arithmetic: the sums a miner does at the kitchen table before plugging a machine in.
The topic looks worn out until you read the actual threads. Someone always writes "I pay 5 cents, it will pay for itself," and the 5 cents almost always came from memory rather than from a bill. What follows is the method for pricing the whole kilowatt-hour, not the part of it that looks good in a spreadsheet.
[IMAGE: dark vector illustration in the site palette, near-black purple background, hexagonal grid behind. Silhouette of a small outbuilding with a ventilation grille on the facade, a transmission line running up to it. Purple accent outline with a glow along the grille and the wire. Flat shapes, no photorealism, no people]
A note on numbers first
Market figures appear in this article only where a verifiable source and a data date sit behind them. Tariffs, model power draw, the bitcoin price, hashprice and pool fees all move faster than the text lives, so every worked example below runs on illustrative values that exist to show the order of operations. The formulas are real. The numbers in them are yours.
Pull the live inputs yourself: current difficulty and hashprice sit on the network difficulty page, revenue goes through the mining profitability calculator, and power draw comes from the spec sheet and, more importantly, from a plug-in meter.
How do you calculate mining profitability after electricity?
Take the machine's daily revenue in fiat, subtract the pool fee, separately work out daily consumption in kilowatt-hours from a wall measurement adjusted for cooling, multiply that by your full all-in tariff including delivery charges and taxes, and subtract it from revenue. What is left is your daily profit. Everything else in this article is about getting those four numbers right.
Step by step:
- Measure wall power in normal operation, in kilowatts. Call it P.
- Daily consumption of the machine itself: E = P × 24, in kilowatt-hours.
- Add site overhead through a PUE factor: E_total = E × PUE.
- Find your all-in tariff T by dividing the final invoice amount by the kilowatt-hours billed in the same period.
- Daily cost: C = E_total × T.
- Daily revenue in fiat: R. Take it from a calculator for your hashrate, or better, from the pool's actual credits over the last seven days divided by seven.
- Subtract the pool fee f: R_net = R × (1 − f).
- Daily profit: R_net − C.
If step eight is negative, the machine is losing money right now, no matter what you paid for it.
Why the tariff on your bill is not the tariff to put in the calculator
The number to enter is not the headline price per kilowatt-hour from your tariff plan. It is the final invoice total divided by the kilowatt-hours actually consumed. Those two figures almost never match, because the bill also carries network delivery charges, supplier margins, taxes and fixed fees that the advertised rate leaves out.
What usually goes missing in a quick mental estimate:
- Network delivery. In many markets the price splits into energy and delivery, and the delivery half can be as large as the energy half or larger.
- Taxes and levies. VAT, excise and earmarked surcharges land on top and are calculated on the already assembled total.
- The fixed connection charge. It does not depend on consumption, so per kilowatt-hour it hurts more the less you use.
- Demand charges. Where a two-part tariff applies, you pay separately for the peak kilowatts you draw. A miner holds a nearly constant load, so it pays that line in full.
- Time-of-use spread. The night rate is lower, but a machine running around the clock lives in both zones, and the number that matters is the weighted average, not the attractive night figure.
- Consumption tiers. Under a progressive scale a miner burns through the residential allowance quickly and ends up in a higher band at a different price.
The practical check takes two minutes. Open last month's bill, find the total due and the kilowatt-hours next to it, divide one by the other. That result is your real tariff. For most people it comes out noticeably higher than the figure they were quoting before they checked.
What does electricity cost around the world?
Residential power spans roughly a thirty-fold range: from $0.006/kWh in Ethiopia to about $0.42/kWh in Germany. GlobalPetrolPrices puts the global household average at $0.176/kWh for the second quarter of 2026. For a mining decision, though, the national average matters far less than the spread inside a country and what the tariff actually includes.
The table below reflects data as of 02.09.2026. The source status column says whether a figure comes from official government statistics or from a commercial aggregator. That distinction is not bureaucratic: different methodologies produce different numbers for the same country.
| Country or region | Rate, $/kWh | Data date | Source status | Taxes and network in the price |
|---|---|---|---|---|
| United States, national average | 0.1834 | June 2026 | official statistics (EIA, Electric Power Monthly, Table 5.3) | yes, full retail rate including delivery and taxes |
| United States, spread by state | from 0.1195 (North Dakota) to 0.4223 in March and 0.5272 in Hawaii in June | March and June 2026 | official statistics (EIA, Table 5.6.A) plus aggregator recalculations | yes, full retail rate |
| Canada, national average | 0.122 to 0.125 | June and December 2025 | aggregator (GlobalPetrolPrices) | yes, taxes included, weighted across providers |
| Canada, spread by province | roughly 0.06 to 0.08 (Quebec, Manitoba) up to 0.25 and above (Northwest Territories, Nunavut) | November 2025 | official statistics (Canada Energy Regulator) | no, the source states taxes are excluded |
| Germany | EUR 0.3869, about $0.42 | H2 2025 | official statistics (Eurostat nrg_pc_204) | yes, taxes and levies included, DC consumption band |
| France | EUR 0.256 | H2 2025 | official statistics (Eurostat) | yes, taxes and network included, DC band |
| Spain | EUR 0.267 | H2 2025 | official statistics (Eurostat) | yes, taxes and network included, DC band |
| Kazakhstan | 0.068 | December 2025 | aggregator (GlobalPetrolPrices) | yes per GPP methodology, component breakdown not published |
| Russia | 0.078 | December 2025 | aggregator (GlobalPetrolPrices) | yes per GPP methodology, no breakdown |
| Georgia | 0.065 | December 2025 | aggregator (GlobalPetrolPrices) | yes per GPP methodology, no breakdown |
| Argentina | 0.102 | December 2025 | aggregator (GlobalPetrolPrices) | yes per GPP methodology, no breakdown |
| Paraguay | 0.067 to 0.068 | December 2025 | aggregator (GlobalPetrolPrices) | yes per GPP methodology, no breakdown |
| Brazil | 0.177 to 0.181 | December 2025 | aggregator (GlobalPetrolPrices) | yes; the tax share of a Brazilian bill is high but the source does not itemise it |
| Indonesia | 0.082 | December 2025 | aggregator (GlobalPetrolPrices) | yes per GPP methodology, no breakdown |
| United Arab Emirates | 0.080 | December 2025 | aggregator (GlobalPetrolPrices) | yes per GPP methodology; country-wide average, we found no per-emirate breakdown |
| Ethiopia | 0.006 | December 2025 | aggregator (GlobalPetrolPrices) | yes per GPP methodology, heavily state-subsidised |
| Iran, estimate | residential 0.01 to 0.02; separate licensed-mining rate 0.04 to 0.07 | mining rate set through May 2026 | media and industry estimate, not an official tariff | unknown; GlobalPetrolPrices returns no figure for Iran at all |
Iran deserves a plain warning. It is the only row here that no regulator and no aggregator confirms. The official tariff is denominated in rials, pegged to a floating exchange rate and not published in dollars, so the range above is a retelling of industry write-ups rather than a primary document. One detail gets confused constantly: the residential tariff and the licensed-mining rate in Iran are two different numbers, and substituting one for the other will wreck a calculation.
Why the same country costs different amounts in different sources
The main reason for the discrepancies is what the price contains. Eurostat and the EIA publish the full retail rate including delivery, network charges and taxes, over a fixed consumption band. Canada Energy Regulator does the opposite and states outright that taxes are excluded, so the provincial figures above should be read as a floor. A real Canadian bill lands higher.
GlobalPetrolPrices is a widely accepted commercial aggregator, not a regulator. It collects data from suppliers and weights it by market share, gives an all-in price "including all taxes and levies," and does not disclose the share of each component. That is why the tax and network column looks vague for the seven countries outside the EU and the US: an official "generation, network, tax" split for Kazakhstan, Georgia, Russia, Paraguay, Indonesia, Ethiopia and the UAE was not found, and inventing one would be a lie.
Two more caveats, without which the table is easy to misread. First, some of these tariffs move fast. The aggregator records Argentina moving 15.2 percent in three months and 52.2 percent year on year, so a December figure is already history by September. Second, seasonality is real. Hawaii differs by roughly ten cents between March and June, and that is not a data error, it is how an island grid behaves.
The main takeaway from the table is that national averages are close to useless for a miner. The US spread between North Dakota and Hawaii is more than fourfold; Canada's spread between Quebec and Nunavut is roughly threefold. Site decisions are made on a local tariff, never on a "national average" line.
The formula: from watts to kilowatt-hours to money
It comes down to four quantities: power, time, price, revenue. The order of operations:
- Power in kilowatts. Say the meter reads 3000 W, so P = 3 kW. The figure is illustrative, it exists only for the arithmetic.
- Daily consumption: 3 × 24 = 72 kWh.
- Monthly consumption: 72 × 30 = 2160 kWh.
- Daily cost at an illustrative 0.08 per kilowatt-hour: 72 × 0.08 = 5.76.
- Daily revenue from a calculator for your hashrate: R.
- Daily profit: R × (1 − pool fee) − 5.76.
Turning that into an annual return only makes sense after you have run ROI with the purchase price and residual value included. That method is covered separately in how to calculate ASIC miner payback honestly.
One thing about scale. A single 3 kW machine eats in a month what a small apartment eats in several. That changes the invoice, the tariff tier you land in, and sometimes the contract with the utility. Budget for the connection capacity you are allowed to draw, not just the price.
[IMAGE: dark vector illustration in the site palette, near-black purple background, hexagonal grid. Close-up of a plug-in power meter in a wall socket, a wattage reading on the display. Purple accent glow around the display and the plug. Flat shapes, no photorealism, no people]
What counts as overhead beyond the miner itself
The machine does not consume everything the site pays for. Intake and exhaust fans, humidifiers, immersion pumps, lighting and network gear all draw power. The ratio of total site consumption to IT consumption is PUE, and your cost calculation has to be multiplied by it. Skip it and the cost is understated by tens of percent.
Where the extra energy goes:
- Ventilation and cooling. At home that is one exhaust fan in a window. In a container it is industrial fans. In immersion it is pumps and dry coolers.
- Power supply losses. A wall meter already includes them, but a spec-sheet figure is sometimes quoted at the DC side and excludes them.
- Wiring and transformer losses. Negligible at home, visible at site scale.
- Always-on support gear: router, switch, cameras, sensors, standby lighting.
- Winter heating or humidification, where the room needs it.
How to express that as one number. PUE equals one when every watt goes into hashing, which is physically impossible. A value of 1.05 means five percent on top for infrastructure, 1.3 means thirty. Take the figure for your own site from your own meter reading rather than from industry reports, because a garden shed and an industrial container are not the same building.
Verifying it is easy. Compare the main meter for the month against the sum of the plug meters on the machines. The ratio is your PUE.
What is a normal PUE for mining?
Mining sites are usually judged against these ranges: air-cooled mining halls 1.1 to 1.5, container farms 1.02 to 1.10, single-phase immersion 1.02 to 1.10, two-phase immersion 1.01 to 1.05. The gap between air and liquid is real, but far smaller than in ordinary data centres, because mining architecture is simpler to begin with.
| Cooling type | Typical PUE | Best in class | Where the numbers come from |
|---|---|---|---|
| Air cooling, mining hall or warehouse | 1.1 to 1.5 | 1.05 to 1.10 with hot-aisle containment and free cooling | mining infrastructure sources (d-central, rax.ae) |
| Container farm, 20 or 40 foot | 1.02 to 1.10 | 1.01 to 1.03 | rax.ae data centre type table, vendor container guides |
| Single-phase immersion | 1.02 to 1.10 | 1.03 in a published Green Revolution Cooling case in Texas | industry summary plus an academic review (Energy Informatics, 2023) |
| Two-phase immersion | 1.01 to 1.05 | 1.02 on the LiquidStack datasheet | vendor datasheet, flagged as vendor data |
| Home installation | not formally measured, see below | the metric does not apply to this scenario |
There is a disagreement inside the immersion data, and showing it is more honest than smoothing it over. The Energy Informatics review consolidates lab measurements into a 1.02 to 1.04 range, yet one of the studies it includes (Eiland et al., 2014) reports a maximum of 1.17. Both numbers stand here, unaveraged. The 1.17 does not refute the range, it is a reminder that a particular installation can land well short of the showroom figure.
The contradiction between mining-specific and general data centre numbers
Two separate data sets get mixed online and start arguments over nothing, so they are worth pulling apart. Mining-focused sources put air cooling at 1.1 to 1.5. A general data centre review (Haghshenas et al., Energy Informatics 2023) puts air cooling at averages of 2.2 to 2.61 across Singapore, Japan, Hong Kong and Australia, with 1.12 at individual hyperscalers such as Google. That is nearly a twofold gap.
Averaging those two figures is wrong, because they describe different buildings. A mining farm is a simple box with a direct air path, no raised floors, no chillers, no redundancy. A general purpose commercial data centre carries all of that engineering, and the engineering costs energy. On immersion, incidentally, the sources agree: both industry and academic data land around 1.02 to 1.04, because the physics of heat removal does not care what the silicon is computing.
The practical rule: use the mining-specific ranges from the table above. Feeding general data centre numbers into a mining site calculation will overstate your overhead by almost double.
Why nobody calculates PUE for a single home ASIC
PUE is not measured for a home setup because the metric does not fit the scenario, not because data is scarce. PUE is the ratio of total facility power to useful IT load, and it needs physically separated circuits to mean anything. An apartment or a garage has no such separation, so the industry uses a different check at home.
Three reasons in detail:
- There is no separate cooling circuit. A data centre meters chillers, UPS and lighting apart from the servers. A home has no cooling submeter: the ASIC's own fans are already inside its rated draw, and any extra room cooling either does not exist or draws a negligible amount on no separate circuit.
- In winter the metric formally drops below one. If a miner heats a living space with electricity that would otherwise have gone into an electric heater, the "wasted" energy is not wasted, it displaces heating. Effective PUE in the household sense comes out under 1.0, which is meaningless for the standard formula, since PUE is by definition never below one.
- A formal PUE report under ISO/IEC 30134-2:2016 assumes measurable building-level infrastructure. A home installation has none.
What to do at home instead: compare the wall meter reading against the miner's own power telemetry. The difference between those two numbers is your overhead, in kilowatt-hours, with no coefficient involved. That is enough to feed the profitability calculator.
How to calculate with a time-of-use meter
With different day and night prices, the number that goes into the calculation is a weighted average tariff, where each zone is weighted by the hours the machine actually runs in it. Multiplying daily consumption by the night rate is wrong for a machine that runs around the clock. The night rate becomes yours only when the machine is genuinely off during the day.
The formula: T_avg = (h_night × T_night + h_day × T_day) / 24, where h is hours in each zone.
An illustrative example, numbers picked purely for the arithmetic. Say the night zone runs 7 hours at 0.04 and the day zone 17 hours at 0.10. Then T_avg = (7 × 0.04 + 17 × 0.10) / 24 = (0.28 + 1.70) / 24 = 0.0825. The result sits much closer to the day price, because there are more than twice as many day hours.
Comparing the two modes:
| Operating mode | What goes into the calculation | Daily revenue | Daily cost |
|---|---|---|---|
| Around the clock | weighted average across zones | full | full, at the average tariff |
| Night zone only | the night tariff | scaled down by running hours | lower, but so is revenue |
| Seasonal operation | average tariff for the months you run | only for months in operation | only for months in operation |
The part people miss: running only at night cuts revenue as well, while fixed costs such as hardware depreciation stay where they are. Night-only operation does not always rescue a site, it moves the break-even point. Run it through the same four quantities as the round-the-clock case.
Break-even: finding the maximum $/kWh for your machine
The highest tariff at which a machine is still not losing money equals daily revenue after the pool fee divided by daily consumption including overhead. The formula: T_max = R × (1 − f) / (P × 24 × PUE). If your real tariff is above that number, the machine is operationally unprofitable before hardware cost even enters the picture.
The procedure:
- Take daily revenue in fiat for your hashrate. Prefer actual over forecast: seven days of pool credits divided by seven.
- Subtract the pool fee. Multiply by (1 − f).
- Work out daily consumption with overhead: P × 24 × PUE.
- Divide the first by the second. That is your maximum price per kilowatt-hour.
- Compare it against the all-in tariff from your bill.
The gap between those two numbers is your margin of safety. A margin of a couple of percent means the next difficulty jump or price dip switches the machine off.
It helps to calculate the ceiling at three points rather than one: at current hashprice, at a third lower, and at half. That shows whether the site survives ordinary market movement. How hashprice behaves and why it falls as difficulty climbs is covered in bitcoin difficulty and hashprice.
[IMAGE: dark vector illustration in the site palette, near-black purple background, hexagonal grid. Stylised figure holding a tablet standing at the open door of an equipment container filled with racks, purple glow spilling from the doorway. Flat silhouettes, no photorealism, no recognisable faces]
Home, hosting and industrial sites calculate differently
At home you pay the full residential tariff and cover cooling yourself. At a hosting facility you pay one rate per kilowatt-hour with infrastructure and the provider's margin already baked in. At an industrial site the energy price is lower, but demand charges, minimum offtake commitments and capital spending on the connection appear. The formula stays the same, the inputs change.
| What we compare | Home | Hosting | Industrial site |
|---|---|---|---|
| Who pays for cooling | you, as a separate line | the provider, inside the rate | you, as a capital item |
| PUE in your calculation | you measure it at the main meter | not needed, already in the rate | you measure it, depends on cooling type |
| Price structure | tariff plus delivery plus taxes | per kWh rate plus possible rack fee | utility contract, demand charge, energy charge |
| What else beyond electricity | noise, load on household wiring | deposit, minimum term, intake and withdrawal fees | substation, cable, staff, security |
| Main risk in the numbers | understating the all-in tariff | missing extra charges in the contract | understating capex and connection lead time |
Rates and terms across facilities are tracked separately in ASIC miner hosting compared, with live offers in the hosting section.
Comparing a home tariff directly against a hosting rate is not a fair comparison. The hosting rate already contains cooling, floor space, staff and connectivity. The honest version looks like this: your all-in home tariff multiplied by your PUE, against the hosting rate plus the amortized cost of shipping the machine there and back.
How the pool fee and payout scheme enter the calculation
The pool fee comes out of revenue before you compare revenue against electricity, so it moves your tariff ceiling directly. The payout scheme matters more than the headline rate: FPPS revenue is smooth and predictable, PPLNS revenue swings week to week, and with PPLNS the break-even tariff should be calculated on a bad week rather than an average one.
Things to account for:
- The fee rate. It is subtracted from revenue: R × (1 − f). One percentage point of fee moves your tariff ceiling by the same one percent.
- The scheme. FPPS shares part of the transaction fees, pure PPS does not, PPLNS depends on the pool's luck inside the window.
- Payout threshold and network withdrawal fee. On a small farm the transfer fee eats a visible share, and it belongs in the annual figure.
- Rejected shares and downtime. Paid hashrate is always below the spec sheet.
How the schemes affect final income is set out on our calculator and pool comparison pages, and the gap between calculator forecasts and real credits is unpacked in why mining profit calculators lie.
Picking a pool to compensate for an expensive tariff does not work, since the difference between schemes never covers the difference in electricity price. But when the safety margin is thin, one extra percent of fee decides whether the machine clears zero.
Why the electricity ceiling moves and how often to recalculate
The ceiling depends on revenue, and revenue depends on network difficulty, the bitcoin price and the fees inside blocks. Difficulty retargets every 2016 blocks, roughly every two weeks, and when it rises, revenue per terahash falls and the maximum tariff the machine can absorb falls with it. Recalculate after every retarget and after any sharp price move.
What pushes the ceiling down:
- Rising network difficulty at a flat coin price.
- A falling bitcoin price in your accounting currency.
- A smaller share of transaction fees per block when the network is quiet.
- Tariff indexation from your utility.
- Worse cooling in summer, which raises fan consumption and cuts effective machine output.
What pushes it up: falling difficulty, a rising price, a fee spike in blocks, or moving to more efficient hardware. Current difficulty and the next retarget are on the network difficulty page.
The habit worth building looks like this. Every two weeks, on retarget day, open your sheet, drop in the new daily revenue and see where T_max sits now. It takes five minutes and it shows you the moment to act, instead of discovering the loss on a quarterly bill.
Common mistakes in the math
The same errors repeat from thread to thread, and nearly all of them inflate expected profit.
- Using the spec-sheet wattage. Real wall draw differs from the label because it depends on firmware, operating mode, temperature and power supply quality. Measure it, do not read it.
- Ignoring voltage deviation. Sag or overvoltage changes both consumption and stability. A machine that reboots on voltage dips loses revenue while still burning power.
- Averaging temperature across the year. Summer raises cooling load and pushes some machines into throttling, winter looks different. An annual figure built on June or January data is wrong either way.
- Forgetting downtime. Outages, maintenance, hashboard swaps, dropped connections. Budget real uptime, not one hundred percent.
- Not counting rejected shares. You get paid for accepted hashrate, not for what the miner panel displays.
- Taking the tariff plan price instead of the all-in cost from the invoice. The most common and most expensive mistake on the list.
- Using a national average instead of your local rate. The US spread is more than fourfold, and a country-level number says nothing about your site.
- Earning in one currency and paying in another without fixing an exchange rate. Revenue in bitcoin, bills in local money, and the rate between them moves on its own.
- Running payback without residual hardware value. The machine is worth something at the end, and that belongs in the calculation.
- Feeding the calculator round "about right" numbers. A two cent error in the tariff becomes a serious sum over a year.
Hashrate and power draw by model are easy to cross-check in our miner ranking, though spec-sheet values stay spec-sheet values there too. You still need the meter.
What to do when your tariff is above the ceiling
There are five practical options, roughly in order of effort and cost. Cut consumption through undervolting, run only in cheap hours, move to a hosting facility, find a site with an industrial connection, or sell the hardware. Switching off and waiting for a better price is also an option, though idle capital has its own cost.
| Option | What changes in the formula | When it makes sense |
|---|---|---|
| Undervolting and firmware tuning | P drops, hashrate drops slightly, T_max rises | when the tariff overshoots the ceiling by a little |
| Running the cheap zone only | T_avg drops and so does revenue | when the day and night spread is wide |
| Seasonal mining | you only count the months you run | when summer cooling is expensive or the tariff is seasonal |
| Moving to hosting | the tariff is replaced by the facility rate, PUE leaves your math | when the all-in home tariff exceeds the hosting rate |
| Selling the hardware | the calculation turns into ROI over the actual holding period | when no scenario clears the ceiling |
An honest word about undervolting: it cuts power more than it cuts hashrate, so revenue per kilowatt improves. Every model has a floor past which stability suffers, and finding the setting is manual work with rejected shares as your feedback signal.
On moving to hosting: the comparison is not against your kilowatt-hour price, it is against the full cost of keeping a machine at home, including noise, wiring wear and your own time. Facility numbers are collected in the hosting comparison.
[IMAGE: dark vector illustration in the site palette, near-black purple background, hexagonal grid. A row of transmission towers with sagging lines receding to the horizon, towers shrinking in perspective, purple glow along the wires. Flat geometric silhouettes, no photorealism, no people]
Short checklist
- Take your last electricity bill and divide the total due by the kilowatt-hours consumed. That is T.
- Measure the machine at the wall in normal operation. That is P.
- Compare the main meter against the sum of the plug meters to get PUE.
- Work out daily consumption: P × 24 × PUE.
- Take a week of actual pool credits and divide by seven. That is R.
- Subtract the pool fee and divide by daily consumption. That is T_max.
- Compare T against T_max. The gap is your margin.
- Repeat after the next difficulty retarget.
Keeping all of this in one sheet and refreshing it every two weeks is enough. A ready-made form for hashrate, power draw and tariff is in the profitability calculator, and the reality check against real credits is in why mining profit calculators lie.
Frequently asked questions
Is electricity the only barrier to mining?
No, but it is the only cost that runs continuously and does not wait for your decisions. Beyond it there is hardware price, available connection capacity, cooling, noise, the legal status of mining where you live, and tax. The tariff decides whether the machine clears zero today. The rest decides whether buying it made sense at all.
What counts as a good tariff for home mining?
There is no universal number, because the ceiling depends on the efficiency of your specific machine and on current hashprice. The better question is the one you can answer: calculate T_max for your model with the formula above and compare it to your bill. The same price per kilowatt-hour can be comfortable for new hardware and fatal for old.
Can I just use the national average from the table above?
As a sense of scale, yes. As an input to the calculation, no. Spreads inside a single country run several times over: EIA data for 2026 puts North Dakota at 0.1195 and Hawaii at 0.5272. Calculate from your own bill, and use the table for comparing regions when you are choosing where to put machines.
Should hardware depreciation be included in the electricity cost?
No, those are different layers. Electricity is an operating cost, depreciation belongs to the return on the investment. First check whether operating profit is positive, then run payback: how to calculate ASIC miner ROI honestly.
Why is my actual revenue lower than the calculator predicted?
Usually several reasons at once: the pool fee, rejected shares, downtime, the gap between rated and real hashrate, and a difficulty retarget inside the period. The mechanics of that gap are covered in why mining profit calculators lie.