

Why your mining calculator lies: forecast versus what actually lands
Draft of article 106. Date: 2026-08-25. Status: awaiting approval.
Every number here comes from our own material: article 96, article 97, article 98, article 81. Nothing beyond those has been added.
The calculator is not lying. It is answering a different question. It takes today's difficulty, today's price, and assumes your machine holds datasheet hashrate for a full day with zero rejected shares. What actually lands on your balance differs for five reasons, and they are wildly unequal in size. The biggest and the most ignored: difficulty retargets every 2016 blocks, roughly every two weeks (article 96), while a one month forecast quietly holds it flat. After that come pool luck on PPLNS, lost shares and downtime, the gap between datasheet and real hardware efficiency, and last of all withdrawal fees plus exchange spread.
[IMAGE: photoreal daylight shot, wooden table on a porch, laptop showing a spreadsheet of mining numbers, a notebook with handwritten figures beside it, green hills and open sky through the window. Bright, calm, natural sunlight]
Where the gap comes from
| Source of error | Direction | How to account for it |
|---|---|---|
| Difficulty growth over the forecast horizon | Almost always down | Compute in chunks: re-enter inputs after every retarget instead of multiplying one day by 30 |
| Pool luck on PPLNS | Both ways, averages out over distance | Judge over a month or more, not a day; or move to FPPS or PPS+ if the swings bother you (article 96) |
| Stale and reject shares, downtime | Down only | Compare live hashrate in the pool dashboard against the rated figure; a gap over 5% is a hardware or link problem (article 96) |
| Real hardware efficiency versus datasheet | Down on revenue, up on the power bill | Measure at the wall with a meter, do not trust the spec sheet |
| Withdrawal fee and exchange spread | Down only | Count what reached your wallet or your fiat, not what was credited |
Why does the calculator show more than I receive?
The calculator prices a perfect day at today's inputs: fixed difficulty, rated hashrate, zero stale shares, full uptime, and a payout with no withdrawal cost. Reality misses every one of those assumptions in the same direction, except pool luck, which moves both ways. That is why the actual number sits below the forecast systematically rather than scattering around it.
How much does rising difficulty eat?
Over any horizon longer than two weeks, this is the dominant term. Difficulty retargets every 2016 blocks, about two weeks, and rises when the network has added hashrate. Your own hashrate does not change, so your share of the network shrinks and your BTC revenue with it. The calculator knows nothing about retargets that have not happened yet.
The scale is visible in the snapshot behind our net income comparison across pools: on 2026-08-14 network hashrate stood at 933.99 EH/s, difficulty at 127,479,855,693,691, block reward at 3.125 BTC, and BTC at 64,558 USD. By the time you read a month long forecast, all four have moved. The first two move on the network's schedule, the third on the halving schedule, the fourth every minute.
The practical fix: stop multiplying a daily figure by 30. Work in two week blocks and feed the new difficulty into the FPPS vs PPLNS calculator after each retarget. A quarterly projection with no recalculation is a brochure, not a forecast.
Why does PPLNS income jump around when FPPS does not?
On PPLNS you are paid out of blocks the pool actually found. A bad luck stretch pays below theoretical expectation, a good one pays above it (article 96). FPPS and PPS+ pay expected value and keep the luck risk on the pool's books, charging a fee for it. The expected total is nearly identical either way.
Do not confuse variance with loss. Per our payout scheme breakdown, expected income barely depends on the scheme: your share of the network is the same wherever you point your hashrate, and 100 TH/s against 933.99 EH/s carries the same expectation at any pool. The scheme redistributes timing, not the sum, and decides who keeps the transaction fees.
We measured that fee component: on the 2026-08-14 snapshot, transaction fees made up 0.70% of block reward across the last 4320 blocks. So the gap between plain PPS and FPPS at that moment was 0.70% of revenue. Considerably smaller than one week of PPLNS luck swing.
Where stale and reject shares go
Some submitted shares never count. They arrive after the network moved to the next block, or they fail validation. The calculator assumes those do not exist. On top of them sit brief connection drops and reboots that add up across a day into a real dent, even when the worker looks healthy right now (article 96).
We deliberately quote no percentage here. It depends on link quality, distance to the pool's stratum server, firmware version and tuning. There is no universal figure, and any writer publishing one without describing the test rig made it up.
[PLACEHOLDER: confirm with the user whether we have our own stale/reject share measurements from real workers, with pool, region and connection type noted. If so, insert here with the measurement date]
The usable rule from article 96 is simple: compare the worker's live hashrate in the pool dashboard against the manufacturer's rating. A gap above 5% points to hardware or connectivity, not to a dishonest pool.
Why real efficiency trails the datasheet
The rated figure was captured under the manufacturer's conditions: specified inlet temperature, fresh chips, nominal voltage. In a shed or a garage the air is warmer, chips degrade, and the PSU and fans draw power too. The penalty runs both ways: slightly less hashrate, slightly more consumption, and both squeeze the margin.
For article 97 we used the Antminer S21 XP Hyd: 473 TH/s, 5676 W, 12 J/TH per the official Bitmain User Guide V4.0.2. That is a hydro unit, among the most efficient on the market. Air cooled ASICs do worse, so most readers will pay more for power than our table shows, not less. Enter a three year old air cooled machine's datasheet number and your forecast is already inflated before any other correction.
How much that matters shows up in our shutdown threshold breakdown: the shutdown price, the BTC price below which a machine runs at a loss, comes out of J/TH efficiency, your electricity rate and the pool fee. The same machine gives two different thresholds to two miners on different tariffs, which is why the $46,787 in that piece is a worked example, not a universal number.
What withdrawal and conversion take
The last layer is the smallest in percentage terms, and it is the one that turns "credited" into "received". The payout threshold holds your money, the network fee trims the transfer, and the exchange spread trims it again on the way to fiat. The calculator prices none of the three.
We do have the threshold arithmetic in article 98: at 100 TH/s, a 0.005 BTC threshold takes roughly 107 days to reach, and a 0.001 BTC threshold roughly 21 days. That is not lost money, but it is the difference between revenue sitting in your wallet and revenue sitting at the pool. For a small farm the threshold outranks the fee: the spread between 1% and 4% at 100 TH/s is about 9 cents a day.
[PLACEHOLDER: confirm with the user the current withdrawal fees for the pools in the article 97 table, plus a typical exchange spread we are willing to publish, with the verification date]
What actually moves your result
We ranked the drivers in article 98, and the order surprises people. Electricity comes first: at 100 TH/s, the difference between $0.05 and $0.12 per kWh was $2.02 a day on the 2026-08-14 calculation. Pool fee comes second: the spread between 1% and 4% is exactly 3% of revenue, about 9 cents a day at the same 100 TH/s. Third is the transaction fee share, PPS against FPPS, the 0.70% from that snapshot.
First place beats second by more than twenty times. That is why arguing over a pool that is half a point cheaper is mostly noise, while a mistyped electricity rate wrecks the whole forecast.
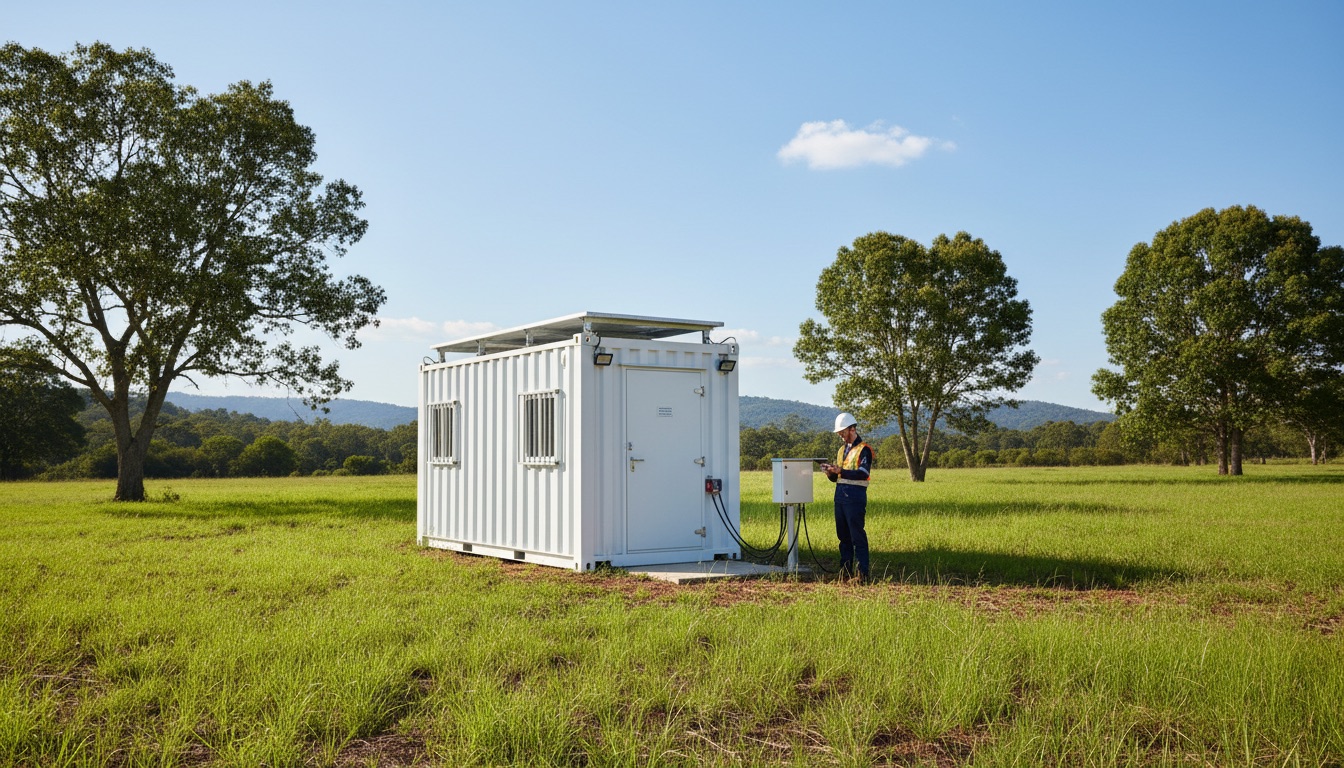
[IMAGE: photoreal daytime shot, a mining container on a green site under open sky, a person with a tablet checking readings nearby, grass and trees around, sunny weather, clear bright tones]
Checklist: how to count honestly
- Enter your real per kWh rate, everything that hits the bill, not the off peak headline number.
- Take consumption from a wall meter, not from the datasheet.
- Take the last 24 hours of actual hashrate from the pool dashboard, not the rated figure. If the gap is over 5%, fix it before you calculate (article 96).
- Enter the pool's real fee and its payout scheme. Fees and thresholds for twelve pools are collected in article 97.
- Forecast in two week horizons, up to the next retarget. Then recalculate from scratch.
- Add the withdrawal fee and exchange spread as a separate line if you are measuring in fiat.
- Track revenue in BTC, not USD. If BTC is flat and USD is falling, the cause is price, not mining (article 96).
- Run the result through the FPPS vs PPLNS calculator and cross check conditions in the pool comparison.
FAQ
My income dropped a few percent this week. Is the pool stealing?
Probably not. Check in order: any difficulty retarget in that window, actual worker hashrate against the rating, the downtime log, and only then the payout scheme. Of the five causes of falling reward in article 96, four have nothing to do with pool honesty.
Which calculator is the most accurate?
Accuracy comes from your inputs, not the algorithm: the formula is the same everywhere. What differs is whether it pulls current difficulty and whether it lets you pick a payout scheme. Our mining profitability calculator compares FPPS and PPLNS on identical inputs.
Should I leave PPLNS for something steadier?
If the daily swings make planning hard, yes. Expected value barely moves, the distribution over time does: FPPS and PPS+ pay smoother (article 98). You pay for that smoothness through the fee the pool charges for carrying luck risk.
Why is a one year forecast always too optimistic?
Because it holds difficulty and price constant across 26 retargets. Difficulty follows network hashrate, and with your capacity unchanged, your share of the network keeps shrinking. A yearly projection only means something as a scenario with a stated assumption about difficulty growth, never as a promise.