

How to tell whether a mining pool ranking is honest: 8 marks of a transparent methodology and how to check each one yourself
A pool ranking is not verified by the reputation of the site that publishes it. It is verified by whether you can reproduce it. A transparent methodology publishes the formula, the source of every field, the snapshot date and the assumptions it leaves out. If you cannot rebuild a single row with your own calculator, you are looking at a shop window, not a ranking. Below are eight marks that separate the two in about a minute, plus the procedure for recalculating somebody else's ranking.
POOL BTC is not a mining pool. It is an independent site that compares other people's pools, calculators and services, and the POOL BTC methodology is published precisely so that it can be checked and argued with. Everything written below applies to our own ranking as well. Check everyone, us included.
What is the difference between a pool ranking and a promotional listicle?
A ranking computes one quantity with one formula for every entry and shows where each input came from. A listicle describes pools one by one in flattering paragraphs, orders them by nothing in particular and usually routes every click through an affiliate link. The first can be rebuilt on your own calculator. The second cannot.
| What to look at | Ranking with a methodology | Promotional listicle |
|---|---|---|
| Row order | Follows one named quantity | Follows the prose, quantity never named |
| Formula | Published, applies to every row | Absent |
| Data source | Named per field | "Based on public sources" |
| Snapshot date | On the table or on each row | Missing, or only a publication date |
| Payout schemes | Separated, FPPS and PPLNS never share a column | Mixed, one fee for everything |
| Affiliate links | Labelled, do not affect position | Determine the order |
| Limitations | A section on what is excluded | None |
The one minute check runs like this:
- Search the page for "methodology" or "how we calculate". No separate page with a formula, only prose about pools, and it is a listicle.
- Take any row and ask yourself which number put it above the next one. If the answer does not surface in fifteen seconds, the order was assembled by hand.
- Find a date. Not the publication date of the article, but the date the fees and network parameters were captured.
- Check whether payout schemes are separated. A single fee column covering both FPPS and PPLNS already means the quantities are not comparable.
- Hover over the first link and look for referral parameters. Their presence is not the problem. The absence of a disclosure is.
Eight marks of a transparent pool ranking methodology
Each mark below is built to be checked from the outside, with no access to the site's internals. None of them asks you to take the publisher at their word, and that is the whole point of the list.
| # | Mark | How to verify it yourself | What its absence means |
|---|---|---|---|
| 1 | Data source disclosed per field | Follow the link to the pool's official page and compare | The figure may be copied from another aggregator along with its error |
| 2 | Snapshot date on the row | Look for a date next to the table, not in the footer | You cannot tell which year's fee you are reading |
| 3 | Network fee and payout threshold included | Look for a column or footnote on the threshold and who pays the network fee | A small miner sees income they will not receive |
| 4 | Payout schemes separated | Check that FPPS, PPS+ and PPLNS occupy separate rows or columns | The comparison adds up different accrual bases |
| 5 | Affiliate links do not affect ranking | Look for an explicit statement and a label on the links | Row order is set by commission rates |
| 6 | Formula is reproducible | Plug in your own numbers and see whether you get the table's figure | The ranking cannot be audited from outside at all |
| 7 | Edit history is visible | Look for a changelog, a last-modified date or an archived copy | Numbers can be changed retroactively |
| 8 | Assumptions are stated | Look for a list of what the model excludes | An estimate is being sold as a measurement |
Here is what breaks without each one.
Data source. Pool fees do not live on the blockchain. They are taken from official pages, from dashboards, or from other people's tables, and the third route produces a game of telephone: one error spreads across a dozen sites and survives there for years. One click on a source link settles it. With no link, treat the field as unverified by default.
Snapshot date. The POOL BTC methodology requires a date on every ranking row showing when the fee and the payout scheme were captured, rather than only the date the page went live. Pools change terms quietly and an announcement is often absent entirely, which is why a screenshot of a pricing page is worth more than a retyped number.
Network fee and payout threshold. For a farm running hundreds of terahash these two barely register. For a single machine they decide the outcome. Luxor has a 0.001 BTC payout threshold plus a 0.000075 BTC network fee carried by the user (Luxor documentation). NiceHash charges a 2% service fee on accrual, and withdrawal is a separate operation with a 0.0005 BTC minimum and a fee from 0.0001 BTC on top (official NiceHash pages, accessed 2026-09-02). A ranking without these fields shows income that will not arrive whole.
Scheme separation. This gets its own section below, because it is where most comparisons break.
Affiliate links. Monetisation is fine. Monetisation that moves rows is not. The POOL BTC rule is stated plainly: affiliate links are labelled, partners do not influence ranking positions, and the order follows the formula. From the outside you can only test this indirectly, but the test is cheap. Check whether the pool with the most generous affiliate programme sits at the top while losing on the site's own numbers.
Reproducibility. This is the only mark that can be verified strictly. Take the formula, plug in your figures, compare with the table. A gap larger than a percent with no explanation means there is a step in the calculation nobody told you about.
Edit history. The Wayback Machine covers this for free. Open the ranking page as archived three months ago and compare the numbers with today. If nothing moved at all, the site either does not update its data or updates it without leaving a trace.
Assumptions. Every ranking is a model, and a model owes you a list of what it leaves out. The POOL BTC methodology excludes short window pool luck, merged mining income, token bonuses and promotions, and withdrawal fees below the payout threshold: the first is statistical noise, the rest are too volatile to compare fairly. A site that names no limitation at all is selling an estimate as a measurement.
Why does comparing pools on the advertised fee alone break down?
Because a percentage describes neither the accrual base nor the cost of getting the money out. FPPS pays a share of network transaction fees, classic PPS does not, and PPLNS pays the actual fees of the blocks found. The same percentage on different schemes yields different income, and different percentages sometimes yield the same.
Here is the arithmetic on verified numbers. By POOL BTC's calculation, at 100 TH/s and the network snapshot of 2026-09-09 (943.73 EH/s, transaction fees at 0.669% of the reward over the last 4320 blocks, mempool.space), expected accrual on F2Pool FPPS at a 4% fee is 0.00004608 BTC per day, and on PPLNS at a 2% fee it is 0.00004704 BTC per day. The gap is 0.00000096 BTC per day, or 0.0000288 BTC over thirty days, which is 2.08% in favour of PPLNS. F2Pool rates: FPPS 4%, PPS+ 2.5%, PPLNS 2% (F2Pool help pages, checked 2026-08-29).
A second calculation shows what the fee share itself is worth. By POOL BTC's calculation, on the same snapshot and at an identical 2% pool fee, a scheme that credits network transaction fees pays 0.669% more than one that does not: 0.00004704 BTC against 0.00004673 BTC per day. In September 2026 that is a rounding error. On other days it has been the whole argument:
| Date | Transaction fees as a share of the reward | Source |
|---|---|---|
| 1 January 2023 | 0.73% | CryptoSlate |
| 8 May 2023, Ordinals peak | 40.8 to 42.59% depending on method | btcoak.com, CryptoSlate |
| 19 April 2024, halving day | 21.4% | btcoak.com |
| 20 April 2024, Runes launch | 73.8 to 75% | btcoak.com, Glassnode via The Block |
| 9 September 2026, last 4320 blocks | 0.669% | mempool.space API |
The practical conclusion follows directly: a ranking with one fee column covering all schemes happens to be right in quiet months and is badly wrong on fee spike days. The longer breakdown of the four components that make up an honest pool score sits in the article on a 1% fee against a 4% fee.

How do you recalculate somebody else's ranking and catch the error?
Take the top row, plug its parameters into the formula against current network data and compare the result with what the site displays. It takes about twenty minutes, and it is enough to separate a ranking that is calculated from a ranking that is drawn.
The formula behind the POOL BTC calculator, as published on the methodology page:
```
miner share = miner hashrate / network hashrate
effective reward = 3.125 BTC x (1 + transaction fee share)
BTC per day = miner share x 144 x effective reward x (1 - pool fee)
```
The procedure:
- Capture today's network parameters: network hashrate and the transaction fee share over the last 4320 blocks. Note your own source so you can compare it with whatever the site used.
- Take the top row of the ranking whole: pool, scheme, fee, payout threshold.
- Open that pool's official page and verify the fee and scheme. A mismatch at this step already answers the question about the ranking's quality.
- Run the formula at a fixed hashrate. 100 TH/s is convenient because the result scales in your head.
- Compare your number with the site's. A gap under one percent is explained by rounding and by a different capture moment.
- Repeat for the bottom row. Methodology errors show up at the edges of a table, not in the middle.
- Check monotonicity. If a higher row yields less income by your own calculation, the order does not follow the quantity it claims to follow.
- Subtract the payout threshold and the network fee for your actual hashrate. Sometimes this is exactly where the first row swaps places with the third.
- Write down what you got, with the date. In a month that becomes your own edit history of somebody else's ranking.
The typical finding at step 7 is boring: two pools sit in the reverse order of their own numbers in the adjacent column. That is rarely fraud. It is usually a manual sort left over from before the last data refresh. The page stops being a ranking either way.
A similar procedure applied to your own payouts rather than to somebody else's table is covered in the article on checking whether your pool pays fairly.
Red flags that disqualify a ranking on sight
| Flag | Why it is a flag |
|---|---|
| "105% of network average yield" | The network pays 100% of the block reward. Anything above it is a subsidy from elsewhere, and the source must be named |
| No snapshot date anywhere on the page | Fees change quietly, an undated figure cannot be verified |
| A single income figure with no range | Income depends on difficulty and fees, both of which move |
| One fee column across all schemes | FPPS and PPLNS accrue from different bases |
| "Best pool 2026" with no formula | An opinion standing in for a measurement |
| Identical figures across a dozen sites | A sign of copying rather than independent collection |
| Pool luck presented as an advantage | On FPPS, luck does not touch a miner's payout at all |
| No section on limitations | A model that does not know its own boundaries |
The first flag deserves a note. Yields above network expectation do exist: merged mining, token programmes, promotional periods and operator subsidies all produce them. Those mechanics are legitimate, but they have to be named and dated, because a promotion ends while the number in the table stays. POOL BTC treats as a red flag not the figure above 100% itself, but its appearance without a named source of the subsidy and an expiry date.
Why do two sites report different numbers for the same pool?
Because they captured data on different days, read the payout scheme differently, apply different deductions and assume a different reference miner. Two honest aggregators produce different figures for one pool simply because they counted on different dates and included different line items. A gap of a few percent is normal and is not evidence of dishonesty.
The main sources of divergence:
- Capture date for network parameters. The network added 5.2% of hashrate in eleven days at the end of August 2026. Two snapshots a fortnight apart give visibly different income at an identical fee.
- Reading of the scheme. One site lists F2Pool under FPPS at 4%, another under PPLNS at 2%. Both are truthful, because the pool offers both.
- Treatment of transaction fees. Whether the fee share is included in the base or not was worth 0.669% on the September snapshot, and would have been worth multiples of that during the Runes peak.
- Deductions. Payout threshold, network fee and auto conversion spread are either folded into the result or counted separately.
- Reference miner. Income at 100 TH/s and at 10 PH/s behaves differently precisely because of thresholds and fixed deductions.
- Electricity. Some sites report net income after power at their own rate per kWh, others do not model power at all.
A practical move: before explaining a gap by bad faith, bring both calculations to the same date and the same reference miner. In most cases the gap collapses to a fraction of a percent.
How do you check that a site refreshes its data instead of showing a six month old snapshot?
Compare its network parameters with current ones and look at archived copies of the page. A stale ranking gives itself away not through fees, which change rarely, but through network hashrate and difficulty. Those move every two weeks, and a half year old capture is obvious immediately.
- Find the network hashrate or difficulty on the page and compare with the current value. A gap of tens of percent means an old snapshot.
- Check whether the latest difficulty retarget is reflected. It happens roughly every two weeks, and a site with live data shows it.
- Open the page in the Wayback Machine as of three and six months ago. Identical figures mean a static table.
- Verify one fee against the pool's official page. If the pool changed its rate and the table did not, the question is settled.
- Reload the page and watch whether the number moves. Live data usually comes from an API and drifts slightly. Static data never moves.
For comparison, the POOL BTC methodology states its refresh rates separately: BTC price and network data refresh every five minutes while a page is open, while pool fees and payout schemes are reviewed manually against official documentation, with rate changes usually reflected within days. Automation and manual review run on different clocks, and a site owes you both numbers rather than one vague promise of being "up to date".
What do you do when two transparent sources disagree?
Do not pick a winner. Recalculate both rows yourself on one set of inputs. If the gap survives after you align the date, the scheme and the reference miner, then the deduction sets differ and you need to find the difference explicitly. The source whose figure you managed to reproduce is usually the one to trust.
The order of work:
- Fix one date and one set of network parameters for both calculations.
- Bring both rows to the same payout scheme of the same pool.
- Write out what each site deducts: pool fee, network fee, threshold, electricity, conversion spread.
- Find the field one has and the other lacks. Nine times out of ten it explains the gap on its own.
- Run the numbers yourself and see whose figure you land closer to.
- If neither can be reproduced, use neither.
When there is no time for any of this, a crude rule works: take the more pessimistic estimate. An error towards understating income costs you an opportunity. An error towards overstating it costs you hardware that never pays for itself.
What this check does not give you
It does not tell you whether the pool itself is honest. A transparent ranking methodology only shows that the site read the pool's public terms correctly and did the arithmetic correctly. Whether the operator honours those terms in practice is a separate question, answered against your own payouts.
It also does not dissolve the assumptions inside the model. Any yield ranking is an estimate as of a snapshot, and it shifts after the next difficulty retarget. Before moving hashrate, run your own figures through the calculator and look at the pool table on the home page rather than trusting somebody's week old capture.
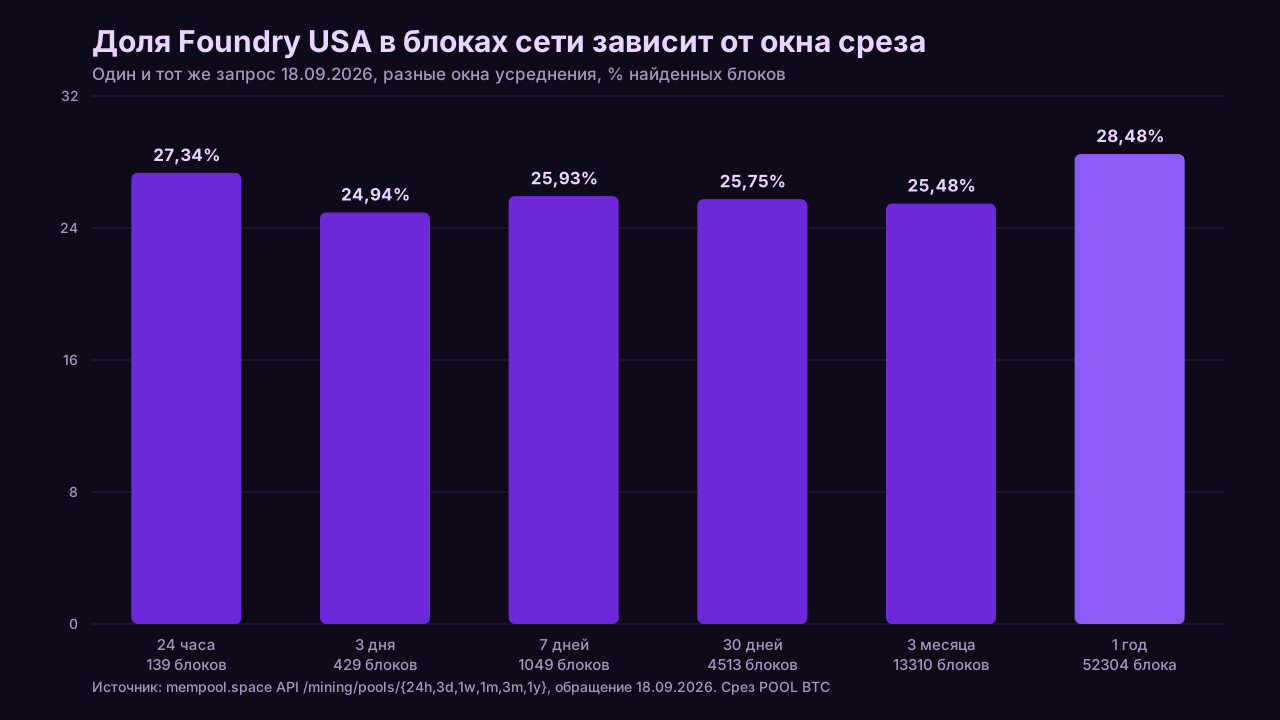
Here is how that looks on our own data, checked on 2026-09-18:
- Foundry USA share of blocks found: 272 blocks out of 1,049 over the last seven days, or 25.93%.
- Combined share of the top 5 pools over the same window: 804 blocks out of 1,049, or 76.64%. The top 10 account for 93.42% (same source, same access date).
- Fees. Braiins Pool publishes its rate outright: 2.5% on FPPS, with a separate note that the fee is waived when you mine on Braiins OS firmware. AntPool's help centre gives 4% on the scheme it calls PPS+ and 0% on PPLNS, while describing FPPS in a separate article without attaching a percentage to it. Foundry USA confirms an FPPS scheme but does not disclose the rate publicly: it is quarterly and tiered by account hashrate. This is exactly the case where an honest ranking prints a dash with a footnote instead of a convenient number.
- Hashprice. The latest public figure carrying a date is 39.25 dollars per PH/s per day as of 2026-09-14 (Hashrate Index). As of 2026-09-18 we found no fresher published value with a date attached, so the dated one is what goes into the arithmetic.
- How often aggregators refresh pool fees. Neither MiningPoolStats nor Hashrate Index nor Braiins publishes a changelog for fee changes: there are only one-off blog announcements when a tariff moves. So refresh frequency can only be checked from the outside through archived copies of the page, never through the site's own claims.
Three of the five items closed with a number and a source, two closed with an honest "the source does not publish this". That is what an assumptions section in any ranking should look like: not a list of wins, but a list of what is known and what is not.
Frequently asked questions about mining pool ranking transparency
How do I tell a pool ranking from a promotional roundup in one minute?
Look for a formula and a snapshot date. A ranking with a methodology puts the formula on its own page and a date next to the table so that any row can be recalculated. A promotional roundup describes pools in paragraphs, never names the quantity it sorted them by, and routes clicks through unlabelled affiliate links.
Why do different sites show different yields for the same pool?
Because they count on different days, under different payout schemes and with different deductions. Network hashrate and difficulty move every two weeks, a single pool often offers FPPS and PPLNS at once, and payout thresholds and network fees are not folded into every site's result. A few percent of divergence between honest sources is normal.
What does an advertised yield above 100% of network expectation mean?
That part of the income does not come from the block reward. The network pays exactly 100%, so anything above it comes from merged mining, a token programme, a promotional period or an operator subsidy. None of that is illegitimate, but the source of the subsidy and its expiry date have to sit next to the number, otherwise the figure cannot be verified.
Can a ranking with affiliate links be trusted?
Yes, when the links are labelled and the site states plainly that they do not affect row order. Affiliate revenue is a normal model for independent comparison work. The problem begins where the ranking order matches the size of the commission, and where the top row loses to a lower row on the site's own numbers.
How do I know the figures in the table are current?
Compare the network hashrate or difficulty against current values and open an archived copy of the page. Fees change too rarely to reveal staleness, while network parameters move every two weeks. Identical numbers in the Wayback Machine three and six months back mean the table is static.
In short
Transparency is not a promise, it is a property you can test from outside. All eight marks reduce to one question: can you reproduce the number yourself on your own data.
A fee detached from its payout scheme means nothing. By POOL BTC's calculation the gap between FPPS at 4% and PPLNS at 2% at one pool on the 2026-09-09 snapshot came to 2.08% in favour of PPLNS at 100 TH/s, and that proportion flips entirely on days when transaction fees spike.
Disagreements between sites are normally explained by date, scheme and deduction set. Align both estimates on shared inputs first, and look for intent only after that.
Check everyone, us included. The formula and the limitations are on the POOL BTC methodology page, and your own case runs in the calculator.