

A 1% Fee Against a 4% Fee: Why Ranking Pools on One Number Breaks, and How to Score Four Factors Instead
The advertised fee is one input out of four, and rarely the decisive one. Next to it sit operator risk, the confidence you can have in the numbers a pool publishes about itself, and payout liquidity: how many days until the coins reach your wallet and how much evaporates on the way. What follows is a scoring method that folds those four into one figure, plus an honest account of where that figure lies to you.
POOL BTC is an independent pool comparison site, not a mining pool. Everything below scores other people's services, and the method is published precisely so it can be argued with.
Multi-factor scoring is not our invention. Minerstat published a breakdown of its opportunity score in September 2026, built from four components (profit, risk, data confidence, liquidity), and that post is what pushed us to write our own approach down. We are not copying their formula and not claiming their coefficients. Only the choice of components overlaps, because those components are obvious to anyone who has ever computed pool revenue by hand.
If you only need the numbers, the fee table for 18 pools with sources and check dates comes right after this introduction.
Which mining pool has the lowest fee?
Among pools that pay in BTC and publish a number, Tpool lists 0.9% on FPPS (checked 2026-09-09) and Trustpool 1% on PPS+ (checked 2026-08-18). AntPool, ViaBTC, F2Pool, Binance Pool and EMCD sit at 4% on their default scheme, Luxor at 2.5%. Foundry USA and Neopool do not publish a fee.
That answers "who is cheapest on paper". Whether the cheapest pool also pays you the most is a separate question, and the rest of this article is about it.
Mining pool fee table: 18 pools with sources and dates
Every row links to the pool's own page. "Checked" is the date POOL BTC last compared the number with that source. Pools change terms without much notice, so open the source before you point hashrate anywhere. A live version of the same data sits in the pool ranking.
| Pool | Fee | Payout scheme | Min payout | Checked | Source |
|---|---|---|---|---|---|
| Tpool | 0.9% | FPPS | 0.0001 BTC | 2026-09-09 | tpool.io |
| Trustpool | 1% | PPS+ | 0.001 BTC | 2026-08-18 | trustpool.cc |
| NiceHash | 2% | RTPPS | 0.00001 BTC (to balance) | 2026-08-18 | nicehash.com |
| Luxor | 2.5% | FPPS | 0.001 BTC | 2026-08-18 | docs.luxor.tech |
| Promminer | 3% | FPPS | 0.0001 BTC | 2026-08-18 | promminer.ru |
| Kryptex Pool | 3% (KAS, RVN: 1%) | PPS+ | 0.001 BTC | 2026-08-18 | pool.kryptex.com |
| AntPool | 4% | FPPS / PPS / PPLNS | 0.005 BTC | 2026-08-18 | AntPool support |
| ViaBTC | 4% (PPLNS: 2%) | PPS+ / PPLNS | 0.001 BTC | 2026-08-18 | viabtc.com |
| F2Pool | 4% (PPLNS: 2%) | FPPS / PPLNS | 0.005 BTC | 2026-08-18 | f2pool.io |
| Binance Pool | 4% | FPPS | not published | 2026-08-18 | binance.com |
| EMCD | 4% | FPPS | 0.0001 BTC | 2026-08-18 | help.emcd.io |
| Foundry USA | not published | FPPS | 0.01 BTC | 2026-08-18 | Foundry FAQ |
| Neopool | not published | FPPS | 0.001 BTC | 2026-08-18 | neopool.com |
| SupportXMR | 0.6% | PPLNS | 0.1 XMR | 2026-08-18 | supportxmr.com |
| HeroMiners | 0.9% | PPS+ / PROP | 0.01 ETC | 2026-08-18 | herominers.com |
| WoolyPooly | 0.9% | PPLNS | 0.1 ETC | 2026-08-18 | woolypooly.com |
| 2Miners | 1% | PPLNS | 0.1 ETC | 2026-08-18 | 2miners.com |
| Nanopool | 1% | PPLNS | 1 ETC | 2026-08-18 | nanopool.org |
Rows where the pool's own page and our manual check of 2026-08-29 disagree (AntPool, Luxor, Binance Pool, F2Pool, EMCD, Neopool, Promminer) are broken down in the section on confidence in published numbers below.
The last five rows are altcoin pools: Monero, ETC, Kaspa, Ravencoin and others. None of them lists BTC, so a low fee there does nothing for someone running a Bitcoin ASIC. They stay in the table because our ranking covers them.
Why the same pool shows two different fees
On FPPS the pool pays for every share whether or not it finds a block, and adds a share of transaction fees. It carries the luck risk and charges for it. On PPLNS you are paid only from blocks the pool actually finds, the risk moves to you, and the fee drops.
ViaBTC and F2Pool show this in their own price lists: 4% on the default scheme, 2% on PPLNS. The trade-off is covered in detail in FPPS vs PPLNS: which payout model to choose.
Which pools do not publish a fee
Foundry USA sets the fee by pricing tier after an application and KYC. Neopool offers individual terms. Neither shows a public percentage, so a small miner has to ask for a quote before any comparison is possible.
Foundry's FAQ explains how the tier is assigned but gives no percentages.
For a narrow head-to-head of three large pools, see TRUSTPOOL vs Foundry USA vs AntPool: fees and payouts. If you are choosing a pool from zero, How to choose a Bitcoin mining pool walks through the criteria in order.
Why does comparing pools on the fee alone give the wrong answer?
Because the fee describes neither what gets split nor whether the money arrives. A pool charging 2% on PPLNS and one charging 4% on FPPS are paying for different things: the second includes block transaction fees in the base. Payout thresholds, network withdrawal costs and the chance the operator rewrites the rules are not in that percentage at all.
Take verified numbers. F2Pool officially runs three Bitcoin schemes side by side: FPPS at 4%, PPS+ at 2.5% and PPLNS at 2% (F2Pool help centre, checked 2026-08-29). Picking the cheapest line and stopping there fails, because PPLNS pays you the actual transaction fees of blocks the pool finds, while FPPS averages them over the previous day and pays regardless of the pool's luck. Which is better depends on your time horizon and on what transaction fees are worth right now.
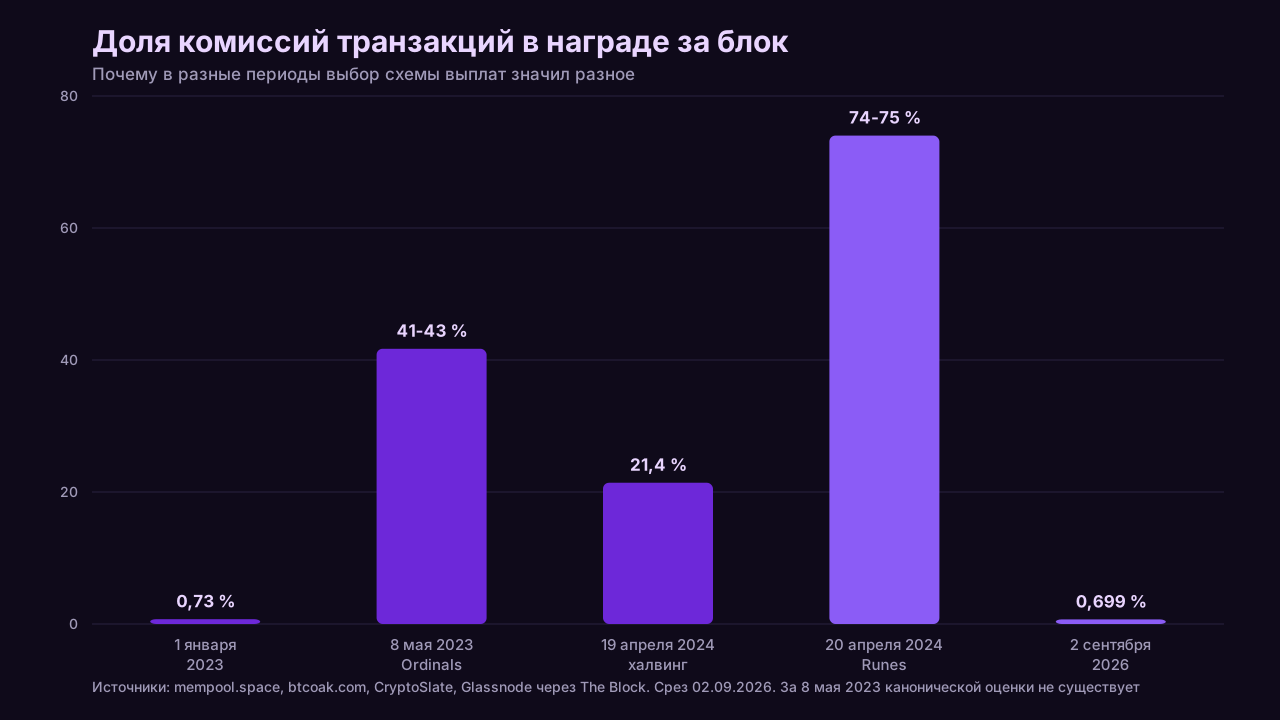
And what they are worth swings between almost nothing and more than the subsidy:
| Date | Transaction fees as a share of miner reward | Source |
|---|---|---|
| 1 January 2023 | 0.73% | CryptoSlate |
| 8 May 2023, Ordinals daily peak | 40.8% to 42.59% depending on methodology | btcoak.com, CryptoSlate |
| 19 April 2024, halving day | 21.4% | btcoak.com |
| 20 April 2024, Runes launch | 73.8% to 75% | btcoak.com, Glassnode via The Block |
| 21 April 2024 | around 40% | DL News, Unchained |
| 2 September 2026, last 4320 blocks | 0.699% | mempool.space API |
| 9 September 2026, last 4320 blocks | 0.669% | mempool.space API |
In the calm fee market of September 2026, the gap between "fees are shared" and "fees are not shared" is a fraction of a percent of revenue, and against that background the advertised fee genuinely is the main factor. On 20 April 2024 the same gap was worth three quarters of the day's revenue. A method resting entirely on one number breaks on exactly those days.
The second thing invisible in a percentage: the cost of getting money out. Luxor's payout threshold is 0.001 BTC plus a 0.000075 BTC network fee, so you need more than 0.001075 BTC on the balance, and the network fee comes out of the user's side (Luxor documentation). NiceHash charges 2% on accrual, and withdrawing from its wallet is a separate operation with a 0.0005 BTC minimum and a fee starting at 0.0001 BTC on top (NiceHash official pages, accessed 2026-09-02). Which of those hurts more depends on your hashrate, not on the storefront percentage.
The full breakdown of everything deducted beyond the advertised percentage lives in a separate piece on what pools really take. The point here is different: even a perfectly computed effective fee is still one component out of four.
What components make up a fair pool score?
Four, and they answer four separate questions. Profitability answers "how much BTC per day". Operator risk answers "what is the chance that BTC never reaches me". Data confidence answers "how much can I trust the first two estimates at all". Liquidity answers "when exactly do I see the money, and what do I lose withdrawing it".
| Component | Question it answers | Where the data comes from | How verifiable from outside |
|---|---|---|---|
| Profitability | Net BTC per day at my hashrate and my power price | Network parameters, payout scheme, pool fee, your tariff | High: network from a public API, fee from pool documentation |
| Operator risk | What happens if the pool shuts down, changes rules or stalls | Terms of service, hashrate share, incident history, balance custody | Medium: partly in the ToS, partly only observable |
| Data confidence | Has the pool actually published what it is being scored on | Official pool pages, date of the last manual check | High, and the only component that needs no trust in the pool |
| Payout liquidity | How many days and what losses before coins land in the wallet | Threshold, payout frequency, withdrawal fee, fate of the remainder | Medium: thresholds are published more often than remainder rules |
The order matters. Profitability comes first because nothing else means anything without it, and data confidence sits third but works as a gate ahead of everything: if the pool's fee is not published, you did not calculate profitability, you guessed it.
Our ranking methodology page currently documents only the first component, the net BTC/day calculation. The other three shaped our selection but were never written down, and this article closes that gap.
How do you compute the profitability component, and why net BTC/day rather than the advertised percentage?
Because a fee percentage is a coefficient inside a formula, not a result. What a miner needs is the net output after the pool's cut and after electricity, expressed in BTC per day at their own hashrate. The same pool can be the best choice for a farm on three-cent power and the worst for a home miner on an expensive tariff.
The formula POOL BTC uses:
```
net BTC/day = (your hashrate / network hashrate) x 144 x (subsidy + average block fees) x (1 - pool fee) - electricity in BTC
```
What matters in each term:
- Network hashrate comes from a public API and moves daily. On the 2026-08-29 snapshot it stood at 896.89 EH/s with difficulty 125,807,076,547,197.5; by 2026-09-09 it was 943.73 EH/s with difficulty 127,450,789,715,843.1 (mempool.space). The network grew 5.2% in eleven days, and any profitability table without a capture date is useless.
- The subsidy is 3.125 BTC per block after the 2024 halving. It is the only genuinely stable input in the formula.
- Average block fees count only for schemes that share them. FPPS and PPS+ do, classic PPS pays from the subsidy alone. That is where the gap between advertised and effective fee comes from.
- Electricity converts to BTC at the current rate. It is the only input that only you know, and it decides the comparison more often than anything else.
Then comes the unpleasant part. The formula asks for "pool fee", and for roughly half the large pools there is nowhere to get it, which is the third component intruding on the first. How the payout scheme changes both variance and the final number is covered in the FPPS and PPLNS breakdown.
None of this needs doing by hand. That is what the payout calculator is for: it pulls current network parameters and takes your price per kilowatt hour.
What is operator risk, and how do you judge it from the outside?
Operator risk is the probability that the revenue you calculated never arrives: the pool closes, rewrites payout rules, stalls for a week, or writes off your balance on a technicality. It cannot be measured precisely from outside, but it has observable markers, and almost all of them sit in public documents nobody reads.
What you can actually check without inside knowledge:
- Terms of service on balances and unpaid remainders. F2Pool spells it out: with no payout address set for more than 90 days, rewards "may be treated as a donation", and under its terms of service, failure to supply a valid wallet address within six months of written notice forfeits the accrued amount. This is not a scandal, it is a normal contract clause, and it deserves reading before rather than after.
- Custody. A pool holding your balance until the threshold is your debtor for that whole period. A pool paying straight to your wallet at a low threshold keeps you a creditor for less time.
- The payout scheme as a risk transfer. PPS-style schemes move variance onto the operator, which is comfortable exactly as long as the operator stays solvent. PPLNS leaves variance with you and leaves the pool owing you less.
- Hashrate concentration. A large share of the network means predictable payouts and a systemic risk to Bitcoin at the same time. Both effects are real, and collapsing them into one score without a caveat is dishonest.
- Incident history and how the pool talked during incidents. A public outage log carries more weight than a pretty uptime figure with no measurement method behind it.
- Jurisdiction and verification requirements. Both change, and they change retroactively for coins already mined.
How network hashrate is distributed across pools
Nobody measures a pool's hashrate directly, so the industry counts blocks instead: an explorer attributes each block to a pool by its coinbase tag and divides by the total blocks in the window. Below is mempool.space data as of 2026-09-09 across two averaging windows, one week and one month. These shares move constantly, and a table like this is only usable together with its capture date.
| Pool | Share, one week (1,051 blocks) | Share, one month (4,477 blocks) |
|---|---|---|
| Foundry USA | 25.12% | 24.95% |
| AntPool | 18.46% | 18.94% |
| F2Pool | 15.03% | 15.23% |
| SpiderPool | 9.51% | 9.45% |
| ViaBTC | 7.80% | 7.80% |
| SECPOOL | 5.71% | 4.42% |
| MARA Pool | 5.04% | 4.89% |
| Luxor | 4.09% | 3.82% |
| OCEAN | 2.47% | 2.55% |
| Binance Pool | 2.00% | 2.05% |
| NiceHash | 1.33% | outside the monthly top twelve |
| Braiins Pool | 1.24% | 1.63% |
Source for both windows: mempool.space Mining Pools API, accessed 2026-09-09.
Two things in that table are worth a reader's time. The top three hold roughly 58% of the network on either window, which is the case where payout predictability at a big pool and systemic risk to Bitcoin grow together. And the gap between windows shows how noisy the figure is: SECPOOL's weekly share runs about a third above its monthly one, while NiceHash sits at 1.33% weekly and drops out of the monthly top twelve entirely. Comparing pools on shares captured on different days with different windows tells you nothing.
Which pools publish a status page
Almost none. We checked nine pools on 2026-09-09, and exactly one keeps a proper status page.
| Pool | Public status page |
|---|---|
| Luxor | Yes: uptime.luxor.tech, per-service uptime (Mining Pool UI, BTC Stratum, Stats Processing), 90 days of history |
| Binance Pool | A status page exists for the whole Binance ecosystem (status.binance.com), but the pool has no separate line |
| F2Pool | Not found on f2pool.com, f2pool.io or the Zendesk help centre |
| AntPool | Not found on antpool.com or in its support section |
| ViaBTC | Not found on viabtc.com or support.viabtc.com |
| Braiins Pool | Not found on braiins.com, pool.braiins.com or academy.braiins.com |
| Foundry USA | Not found; the status.foundry.ac domain belongs to a different company |
| EMCD | Not found; the site carries a marketing line about 99.9% uptime with nothing measurable behind it |
| Ocean | Not found; ocean.xyz/stats offers live statistics, which is not an incident log |
That matters more than it looks. Advertised uptime is essentially unverifiable from outside: eight of nine pools publish neither an incident history nor a measurable availability figure, so a marketing claim of 99.9% is an assertion with no way to disprove it. The only checkable quantity here is not a percentage but whether the page exists at all.
A note on uptime as a metric. None of the pools in our dataset publishes a measurable availability figure with a stated method: a published number becomes an obligation, and measuring it honestly has to happen from outside. So uptime enters the risk score as an observable marker (is there a status page, are there multiple entry points), never as a percentage.
How do you judge the confidence you can place in a pool's own published numbers?
By one test: has the pool put its fee and threshold on its own site, without a login, with a date. If the fee is known only through aggregators, you are not comparing a pool, you are comparing somebody's retelling of it. This component is fully verifiable from outside, which makes it the only one that does not require taking the operator at their word.
Here is what that looks like in practice. During the 2026-08-29 review we opened the disputed pages manually in a browser:
| Pool | What the 2026-08-29 check found | Confidence level |
|---|---|---|
| Kryptex Pool | pool.kryptex.com served the page: PPS+ 3%, minimum payout 0.001 BTC | Published on the official page |
| F2Pool | Help centre publishes FPPS 4%, PPS+ 2.5%, PPLNS 2%, threshold 0.001 BTC | Published on the official page |
| ViaBTC | Pricing page confirmed PPS+ 4% and PPLNS 2%, threshold did not render | Partly published |
| NiceHash | 2% service charge, withdrawal fees on a separate official page | Published on the official page |
| Luxor | Threshold 0.001 BTC plus 0.000075 BTC confirmed in docs, the fee rate itself is not published, only the discount-to-spot-FPPS mechanic | Half disclosed |
| AntPool | Site loads, fees not published, /help/fee returns 404 | Not published, numbers only from aggregators |
| Binance Pool | Fee page redirects to login, no public version | Not published, behind a login |
| EMCD | Pool page loads as an empty JS shell, help centre gives 4% for BTC, threshold contradicts itself (0.0001 against 0.001 BTC) | Published with an internal contradiction |
| Foundry USA | Fee not disclosed, tiered | Not published |
| Neopool, Promminer | Official pages did not load, data only from aggregators | Not verified |
One conclusion from that table matters more than any ranking: for four pools on the list, the fee number in any comparison, ours included, is not a fact but a dated rumour. And when two pools differ by half a percentage point while one of them publishes no fee at all, that half point means nothing.
The scale we use:
- Published on an official page, opens without a login, carries the date of our manual check.
- Published but incomplete: some parameters public, others only in support tickets or chat.
- Behind a login or available only through aggregators, no official confirmation.
- Sources contradict each other and the contradiction is unresolved.
Level four shows up more often than anyone would like. EMCD has given us two conflicting thresholds since August, and the right response is not "pick whichever looks plausible" but "mark it unresolved and build no comparison on it".
What is payout liquidity, and why do the minimum threshold and payout frequency matter more than they look?
Liquidity is how fast mined coins turn into money in your own wallet. The arithmetic is trivial: divide the payout threshold by your net BTC/day. For a farm that is hours. For a single home ASIC it can be months, and for all those months the balance sits with the operator whose rules can change.
Verified thresholds and deductions across several services:
| Pool or service | Threshold | Withdrawal fee | What to remember |
|---|---|---|---|
| Luxor | 0.001 BTC | 0.000075 BTC network, paid by the user | You actually need more than 0.001075 BTC |
| F2Pool | 0.001 BTC | not separately confirmed | A balance below the threshold carries over, it is not burned |
| Kryptex Pool | 0.001 BTC | exchange and withdrawal fees exist, amounts not on the page | Amount undisclosed, that is confidence level 2 |
| NiceHash | 0.00001 BTC to balance | withdrawal: 0.0005 BTC minimum, fee from 0.0001 BTC | The accrual threshold and the withdrawal threshold are different thresholds |
| Kryptex App, on-chain | 0.00025 BTC | 0.00003 BTC | A separate product, not the pool |
| Kryptex App, Lightning | 0.00001 BTC | 2% | Cheaper on chain costs, dearer in percentage |
| EMCD | 0.0001 BTC to an external wallet per help centre | network fee paid by the operator per ToS | A second source says 0.001 BTC, conflict unresolved |
Three things break liquidity math more often than anything else.
An accrual threshold and a withdrawal threshold are not the same number. NiceHash credits your balance from 0.00001 BTC, but you cannot withdraw less than 0.0005 BTC, fifty times more. Comparing the first figure with an ordinary pool's threshold is meaningless.
A flat withdrawal fee is a percentage in disguise, and the percentage depends on the amount. A 0.00003 BTC fee on a 0.00025 BTC withdrawal is 12% of the sum; on 0.01 BTC it is 0.3%. The same tariff line means two different things to a home miner and to a farm.
The remainder when you leave. The rule "a balance below the threshold accumulates and is not burned" is officially confirmed for F2Pool, ViaBTC and Luxor. For the other pools we found no direct official wording, which means that when you switch pools, the leftover on the old balance is an open question rather than a guarantee.
How long it takes to reach a payout threshold
This is expected value, with no scheme-specific variance in it:
```
miner share = miner hashrate / network hashrate
BTC per day = miner share x 144 x effective_reward
days to payout = threshold / BTC per day
```
Effective reward is the subsidy plus average block fees. On the 2026-09-09 snapshot the network stood at 943.73 EH/s and transaction fees made up 0.669% of the reward over the last 4,320 blocks, so effective_reward = 3.125 x 1.00669 = 3.1459 BTC. Against 896.89 EH/s on 2026-08-29 the network grew 5.2%, and waiting times grew by the same 5.2% for everyone who did not change hardware.
| Miner hashrate | Threshold 0.0001 BTC | Threshold 0.001 BTC | Threshold 0.005 BTC | Threshold 0.01 BTC |
|---|---|---|---|---|
| 100 TH/s, a typical home ASIC | about 2.1 days | about 20.8 days | about 104.2 days | about 208.3 days |
| 1 PH/s | about 5 hours | about 2.1 days | about 10.4 days | about 20.8 days |
This is our own calculation from the formula above, not pool-reported data. Real variance under PPLNS or TIDES is not modelled here, and on those schemes the spread around the expected date is noticeable. The practical reading is simple: a 100 TH/s home ASIC waits about three weeks for a 0.001 BTC threshold, and the operator holds the money for all three weeks. At a 0.01 BTC threshold the wait passes half a year. Plug in your own hashrate and tariff in the payout calculator.
How do you combine the components into one score, and with what weights?
As a weighted sum of four normalised scores, with data confidence doubling as an admission filter. The weights below are our choice and our responsibility, not an industry standard: anyone who disagrees is free to set their own and get a different ordering. That is exactly why they are published instead of buried in code.
The procedure:
- Compute net BTC/day for every pool at the same hashrate and the same electricity price. Different inputs for different pools is the single most common comparison error.
- Normalise profitability to a 0 to 100 scale within the compared set: best pool in the set takes 100, worst takes 0. The score is relative, and that has to be remembered when reading it.
- Score operator risk from the observable markers above. The scale is coarse on purpose: 0, 25, 50, 75, 100. Precision here would be fake, and pretending risk is measured to the percentage point helps nobody.
- Score data confidence on the four-level scale and convert: level 1 is 100, level 2 is 66, level 3 is 33, level 4 is 0.
- Score liquidity as threshold divided by your daily revenue, normalised like profitability: faster is higher.
- Apply the weights and sum.
Proposed weights:
| Component | Weight | Why that much |
|---|---|---|
| Profitability | 50 | It is why the miner is here. Giving it less than half the weight is dishonest |
| Operator risk | 20 | Rarely materialises, wipes out profitability entirely when it does |
| Data confidence | 20 | Just enough that an unverifiable pool cannot beat a verifiable one on a tenth of a percent of fee |
| Liquidity | 10 | For most farms an inconvenience rather than a loss. For a home miner the weight should go up |
One hard rule sits above the sum: a pool at data confidence level 3 or 4 is not ranked at all. It appears in the list flagged "data unconfirmed" and without a total. Otherwise you get the absurd outcome where a pool scores well on an attractive fee that nobody could confirm.
What it looks like on a single pool:
```
Profitability 82 x 0.50 = 41.0
Risk 75 x 0.20 = 15.0
Data confidence 100 x 0.20 = 20.0
Liquidity 60 x 0.10 = 6.0
Total 82.0
```
Why we publish no table of final scores per pool
Because no such table works for every reader, and publishing one would manufacture an impression of objectivity that the numbers cannot support. The reasons are concrete.
First, three of the four components depend on inputs that differ per reader. Profitability runs on your hashrate and your price per kilowatt hour; liquidity runs on how long the threshold takes you to reach. A 100 TH/s home ASIC waits about three weeks for a 0.001 BTC threshold, a 1 PH/s farm about two days. The same threshold yields different scores for different readers, and there is no meaningful average to collapse them into.
Second, several pools we compare do not clear the admission filter. Foundry USA and Neopool publish no fee rate, and for AntPool, Binance Pool and Luxor the rate we found sits in a support article, a social post or documentation rather than on an official fee page we could open on 2026-08-29, so by our own rule they get no total at all. A table with that many empty rows is not a ranking.
Third, weights are a choice rather than a measurable quantity. Our 50/20/20/10 encodes a view of what matters, and any other arrangement produces a different ordering. A composite pool score is always an author's decision, never a property of the pool.
How to set weights for yourself. If you run one or two machines and the threshold takes weeks, raise the weight on liquidity and lower it on profitability: half a percent of fee at that volume is worth less than a month of waiting. If a meaningful sum sits on the balance at all times, raise operator risk. If you are simply unwilling to act on unconfirmed numbers, treat data confidence as a hard filter rather than a weight, and drop level 3 and 4 pools out of the comparison entirely.

When does a composite score lie, and what has to be checked by hand?
It lies in three typical situations: when averaging hides a failure in one component, when the set of compared pools is assembled so that normalisation distorts the picture, and when the numbers inside the components come from different dates. A composite score is a convenient compression, not a verdict, and the decision comes after checking the raw inputs.
Where it breaks:
- Averaging hides a zero. A pool can post a respectable total on zero data confidence if its paper profitability leads the set. That is what the admission rule in the previous section exists for.
- Normalisation depends on the set. The same pool scores 100 on profitability among five expensive pools and 60 among fifteen. Scores are comparable within one snapshot and not comparable across snapshots.
- Dates drift apart. The fee was checked in August, network parameters were captured in September, the BTC price is yesterday's. The total looks like one coherent number while resting on three different days.
- Weights are taste. Our 50/20/20/10 encodes our view of what matters. Yours may differ, the ordering will change, and the arithmetic will not be at fault.
- Switching cost is not in the score. ViaBTC describes its PPLNS window as the past 5 difficulty rounds, and Ocean runs TIDES with a window of 8 times network difficulty. Leaving such a pool wipes out the position accumulated in the window, and a one point difference does not pay for that.
- A pool changes terms inside the scoring window. Fees and thresholds are current values, not constants. Checking monthly means spending a month acting on a stale number.
What to check by hand before you point hashrate anywhere:
- Open the chosen pool's official fee page yourself and confirm you see the same number as the comparison.
- Find the payout threshold and the rule on balances below it. If no rule is public, assume the remainder is lost when you leave.
- Read the terms of service section on unpaid rewards and deadlines.
- Confirm the payout scheme on your account matches the one in the comparison. Several pools let you pick a scheme in settings, and the default is not the cheapest one.
- Recompute revenue on your own electricity price, not on a market average.
How do you use this method when actually picking a pool?
As a filter rather than a leaderboard. First drop the pools whose data is unconfirmed, then compute profitability on your own inputs, then look at liquidity against your hashrate, and only then compare totals across the two or three survivors. The whole thing takes an evening and saves months on the wrong pool.
The sequence:
- Build the candidate list. A current snapshot of fees, schemes and thresholds sits in the pool cards, which also shows which figures are officially confirmed and which are not.
- Drop everyone at data confidence level 3 or 4. This does not mean the pool is bad, it means there is nothing to compare it on.
- Compute net BTC/day in the calculator at your hashrate and your price per kilowatt hour. Not an average, not "typical for the region".
- Divide each candidate's payout threshold by that daily figure. That is your days to first payout. If it exceeds a month, liquidity is your dominant factor, not the fee.
- Read the remainder and unpaid-reward clauses for the two finalists.
- Set the weights for your own situation. If two pools land within 5 points of each other, the gap sits inside the error bars of the input data, and the tiebreaker should be what never got quantified: support language, response speed, whether a status page exists.
- Record the date of the check and revisit it in a quarter. Fees and thresholds move, and a decision made on last year's data is no better than a decision made on rumour.
One case where the method does not apply: if you are seriously weighing solo mining, the components are the same but the weights are not, because variance stops being a parameter and becomes the entire story. That is covered in the solo against pool comparison.
In short
Comparing on fee alone works only in a quiet transaction fee market and only for a miner indifferent to payout timing. As soon as undisclosed tariffs, 0.001 BTC thresholds and unpaid-remainder clauses enter the frame, one number stops describing reality.
Four components instead of one do not make the score accurate. They make it honest: you can see what went into it, what weight each part carried, and where the data simply does not exist. A pool with an unpublished fee does not deserve a low score, it deserves no score, and admitting that beats plugging an aggregator's number into the formula.
FAQ
Which Bitcoin mining pool has the lowest fee?
Among BTC pools with a published fee, Tpool (0.9%, FPPS, checked 2026-09-09) and Trustpool (1%, PPS+, checked 2026-08-18). Check the pool's page before switching, terms move.
What fee do AntPool, F2Pool and ViaBTC charge?
4% on the default scheme according to the sources in the table, checked 2026-08-18. F2Pool and ViaBTC charge 2% on PPLNS.
What is the Foundry USA pool fee?
Foundry does not publish one. It depends on a pricing tier assigned after application and KYC.
Why is FPPS more expensive than PPLNS?
On FPPS the pool absorbs luck risk and pays for every share plus a share of transaction fees. On PPLNS the miner carries the risk, so the fee is lower.
Which pool has the lowest minimum payout in BTC?
NiceHash credits from 0.00001 BTC, but withdrawal from its wallet starts at 0.0005 BTC. Among classic pools, Tpool, EMCD and Promminer list 0.0001 BTC.
Is the lowest-fee pool the most profitable?
Not necessarily. Net income depends on the scheme, transaction fee sharing, payout threshold and operator risk as well. Put your hashrate and power price into the payout calculator and compare two pools side by side.
This article contains referral links to mining pools (marked as sponsored). We may receive a reward if you register through them. This does not change the figures or the order of rows in the tables: the terms are taken from the pools' official pages.