

Checking whether your pool pays fairly: a 30 day method you can run yourself
Sooner or later every miner asks the same question. Revenue dipped while difficulty stayed flat, or the pool dashboard shows less hashrate than the machine reports, or the week closed at 82% luck and the chat is already talking about theft.
Part of that question is answerable. Part of it is not, and no amount of spreadsheet work will change that. Block data, coinbase attribution and your own payout transactions are public. What happens inside the pool between your submitted share and your balance is visible only through the pool's own reporting.
POOL BTC is not a pool. We compare other people's terms and work out what they cost a miner, so what follows is a procedure rather than an accusation. Run it on your own numbers.
What can you actually verify, and what can never be verified?
You can fully verify anything written to the blockchain or measured by your own hardware: blocks the pool found, the fees inside those blocks, the amounts that landed on your address, your hashrate and your reject rate. Everything internal to the pool, from share accounting to the PPLNS window, exists for you only as a report.
| Verifiable | How | What it proves |
|---|---|---|
| Blocks found by the pool | Explorers, coinbase tag attribution (mempool.space) | The pool mines and its share matches its claims |
| Transaction fees in a block | mempool.space API by block height | How much above the subsidy the pool collected |
| Payout amount and timing | The transaction on your address in any explorer | Whether what arrived matches what left your balance |
| Your hashrate | ASIC web interface, firmware, local monitoring | The baseline for comparison with the dashboard |
| Rejected and stale shares | ASIC counters and pool statistics | Explains part of any hashrate gap |
| Your share of a PPLNS window | Not verifiable | Requires every share from every miner |
| The pool's real hashrate | Not directly verifiable | Block share is a statistical proxy, not a measurement |
| The pool's cost structure | Not verifiable | Nobody is obliged to publish it, and nobody does |
The honest conclusion from that table: a miner cannot prove fraud. A miner can prove to himself that no discrepancy exists, and if one does exist, localize it and put it in front of the operator as arithmetic.
Why does the pool dashboard show less hashrate than your ASIC?
Because they measure different things. Your machine reports instantaneous hashing speed. The pool estimates your hashrate after the fact, from accepted shares over an averaging window. They cannot match by construction, since the pool only counts what reached it and passed validation.
Four ordinary reasons for the gap:
- Averaging window. A five minute figure swings by tens of percent, a 24 hour figure is smooth. Compare daily to daily, never instantaneous to daily.
- Share variance. Finding a share is a random process, and short windows carry real noise.
- Rejected and stale shares. They drop out of accounting, so your effective hashrate sits below nameplate.
- Network latency. The further the stratum server and the worse the link, the more work arrives already outdated.
Some pools publish what they consider a normal reject rate. The published numbers disagree with each other, and no industry standard exists.
| Pool | What it publishes | Wording |
|---|---|---|
| AntPool | Normal rejection rate | Under 1%, and separately an average stale rate of 0.5% or lower depending on hardware |
| ViaBTC | Normal rejection rate | Within 3% |
| F2Pool | Reasonable delayed share rate | Around 2% |
| Braiins | No numeric threshold published | Not found in open documentation |
| Luxor | No numeric threshold published | Docs explain stale shares without giving a percentage |
Source: AntPool, ViaBTC and F2Pool support pages, checked 09.09.2026. Those pages return 403 to automated fetching, so the quotes come from search snippets against the same URLs rather than the page bodies. Worth opening by hand if the exact wording matters to you.
The spread between 0.5% and 3% carries a practical meaning: "normal" for your pool is defined by your pool, not by the industry. A workable alarm threshold is a persistent gap above 5% on the daily figure that your reject rate does not account for.
How do you calculate expected earnings and compare them to actual?
Take your share of network hashrate, multiply by the effective block reward and by the number of blocks per day. One formula covers every scheme. What changes between schemes is how far the actual credit is allowed to wander from that line: barely at all on FPPS, visibly on PPLNS.
```
miner share = miner hashrate / network hashrate
reward_eff = 3.125 BTC × (1 + transaction fee share)
BTC per day = miner share × 144 × reward_eff × (1 - pool fee)
```
Using the network snapshot for 09.09.2026: network hashrate 943.73 EH/s, transaction fee share over the last 4320 blocks 0.669%, so reward_eff = 3.125 × 1.00669 = 3.1459 BTC. Difficulty on the same date was 127,450,789,715,843.1 (mempool.space, accessed 09.09.2026).
FPPS and PPS+: the daily credit has to be flat
On FPPS the pool pays a fixed rate per submitted share, transaction fees included, whether or not it found a block that day. Your daily credit should therefore track the calculated line closely. A Monday that pays half of Tuesday on identical hashrate is not scheme variance on FPPS, it is something to ask about.
PPS+ works the same way on the subsidy, but distributes transaction fees against blocks actually found, so a modest day to day spread is expected. What these schemes turn into in dollars on the same hashrate is worked out in the article on FPPS, PPS+, PPLNS and SOLO.
PPLNS: only compare over a long window
PPLNS pays you a slice of blocks the pool actually found. No block, nothing to distribute, and the daily number jumps around. Comparisons make sense over a month at minimum, and a quarter is better. Your first days on a new PPLNS pool almost always look like underpayment, because the window has not filled with your shares yet.
The comparison itself:
- Record your daily hashrate from the pool dashboard for every day of the period.
- Record network hashrate and the transaction fee share for each of those dates, not one value for the whole month. Between 29.08 and 09.09.2026 the network went from 896.89 to 943.73 EH/s, up 5.2%, and everyone who did not change hardware lost exactly that much.
- Compute the expectation for each day and sum it.
- Sum the actual credits for the same days from the pool report.
- Compare the two totals and express the gap as a percentage.
- Separately, sum what actually arrived at your wallet and compare it to what left your pool balance. Those are two different checks: crediting and delivery.
Run your own numbers through the mining calculator, check payout timing per pool on the payout time page, and see how we build our own estimates in the methodology.
What is pool luck, and does low luck prove cheating?
Luck is the ratio of blocks actually found to the number expected from the pool's hashrate over a period. At 100% the pool found exactly what statistics predicted. It is a random variable, so a week at 80% or at 130% is ordinary dispersion and evidence of nothing.
The part most arguments miss: on FPPS and PPS, luck does not touch your payout at all. The pool pays a rate and absorbs the bad streaks itself, which is precisely what the higher fee compared to PPLNS buys. Asking for a recalculation after an unlucky week on FPPS makes no sense, because the week was already paid at the formula rate.
On PPLNS and TIDES luck feeds straight through: no block means no distribution. Low luck there genuinely reduces your income, but that is a property of the scheme rather than an action by the operator. Judge it over a quarter, and only when the pool's block share in public tables stays flat.
Three things worth checking before drawing conclusions from a luck figure:
- The window: per round, per day, or 30 day rolling. Different windows tell different stories about the same data.
- Whether luck is computed by block count or by round shares. The second is steadier.
- Whether the block count in the pool's report matches the count attributed to it by public explorers.
A ready reference of the form "this is what weekly luck looks like at a major pool" is not something we can give you, and it is worth knowing why up front. None of the sources we checked publishes a series of actual weekly or monthly luck over the past twelve months with a stated methodology. Here is what actually exists as of 2026-09-11:
- F2Pool shows luck widgets for 3, 7, 30 and 90 days on its statistics page and keeps a separate log of blocks found with the luck of each. Those are rolling windows as of right now, not an archive of last year's weeks. The pool states the method in its help center: blocks actually found divided by the count theoretically expected from the pool hashrate.
- ViaBTC explains the same formula on its blog with a single worked example: a seven-day luck of 92.17% on 2024-05-07. There is no continuously published series there, it is an illustration of the method.
- Antpool keeps no dedicated public luck page on its official resources.
- Braiins publishes a historical month-by-month hashrate distribution across pools going back to 2012, but that is shares of power, not luck.
- Independent trackers such as soloblocks.io and blocksrace.com compute luck by the same formula over short windows, from a few hours to 30 days. The first of them states outright that it has no yearly data accumulated yet: the service has been running since March 2026.
The practical conclusion is straightforward. Compare your pool not against an industry "norm" that is not publicly available, but against its own figure over a long window: look at the 90-day luck where the pool publishes it, and cross-check the block count against public explorer tables. That is exactly why the next section is about blocks rather than luck.

How do you confirm a pool is really finding blocks?
Through the coinbase transaction. Every block carries one, and pools put a text tag and the reward address in it. Explorers collect those tags into attribution tables, which is why anyone can count a given pool's blocks without any access to its dashboard.
The procedure:
- Open the pools table on mempool.space for the one week and one month windows.
- Find your pool and note its block count and share.
- Compare that share to whatever the pool claims about its own hashrate on its site.
- Take two specific blocks from the pool's own report and look them up by height. The coinbase should carry that pool's tag.
- If the pool never appears in public tables at all, ask support why. "We do not tag our coinbase" is a checkable answer. "Commercially sensitive" is not.
Here is the distribution per mempool.space on 11.09.2026:
| Pool | Blocks, 1 week | Share, 1 week | Share, 1 month |
|---|---|---|---|
| Foundry USA | 254 | 24.76% | 25.19% |
| AntPool | 192 | 18.71% | 18.92% |
| F2Pool | 146 | 14.23% | 14.81% |
| SpiderPool | 103 | 10.04% | 9.38% |
| ViaBTC | 94 | 9.16% | 8.05% |
| SECPOOL | 51 | 4.97% | 4.40% |
| MARA Pool | 44 | 4.29% | 4.94% |
| Luxor | 38 | 3.70% | 3.87% |
| OCEAN | 30 | 2.92% | 2.60% |
| Binance Pool | 23 | 2.24% | 2.07% |
| NiceHash | 16 | 1.56% | 1.25% |
| Braiins Pool | 15 | 1.46% | 1.51% |
The weekly window covers 1026 blocks, the monthly one 4497. Source for both: mempool.space Mining Pools API, accessed 11.09.2026.
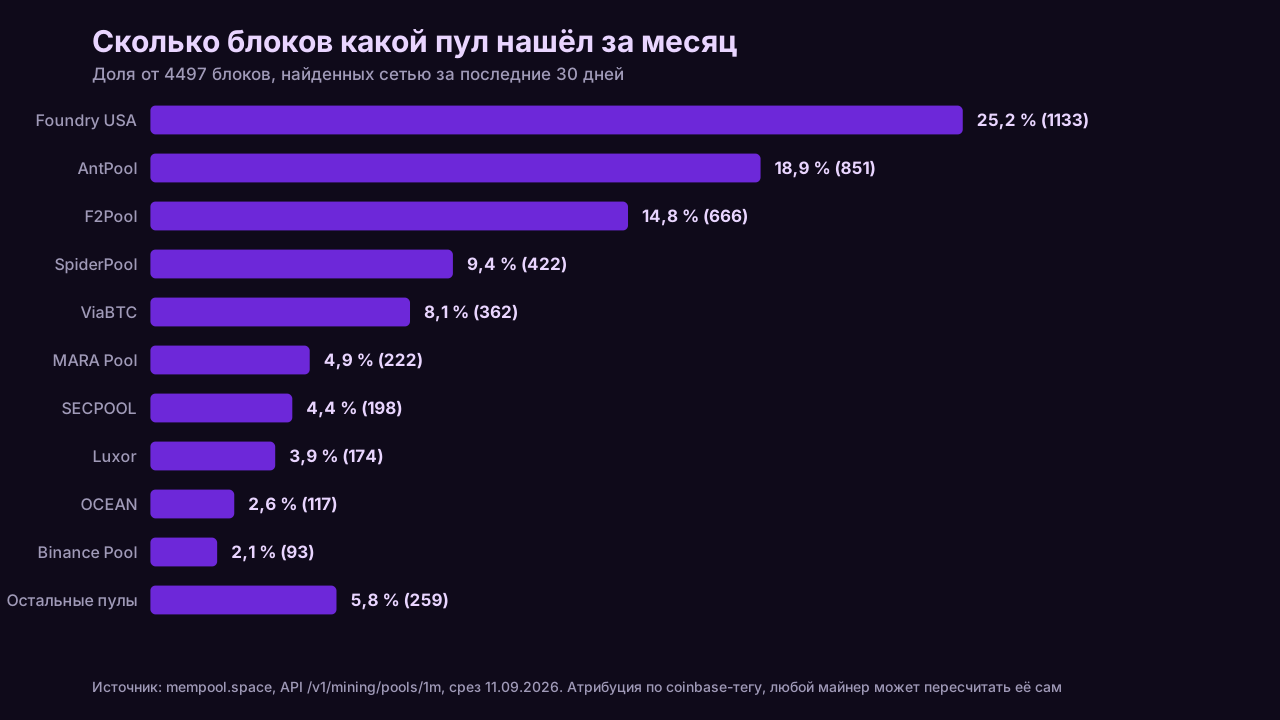
One methodological caveat. Block share is a proxy for hashrate, not a measurement of it, so read the weekly and monthly columns together. A point or two of difference between them, as with SECPOOL and NiceHash above, is ordinary variance on small counts rather than a pool gaining or losing machines. Who actually assembles the contents of a block, and why that is a separate question, is covered in the piece on Stratum V2.
Where do the transaction fees in a block go under FPPS?
In a correct FPPS implementation they go into your rate. The pool averages the fee share across recent blocks, adds it to the subsidy, and takes its own fee off the total. That is the whole difference from plain PPS, where you are paid on the subsidy only and the fees stay with the pool.
Right now the amount is small. Per mempool.space, transaction fees made up 0.66% of block rewards over the last 4320 blocks on 08.09.2026 and 0.669% on 09.09.2026, while a 144 block window gave 0.57%. Over the past month the range sits at 0.66-0.73%, which is a quiet fee market with no Ordinals or Runes style event in it.
Different aggregators produce different numbers from the same chain, and that is methodology rather than error. In early September 2026 daily metrics from Glassnode and Newhedge showed 0.40-0.56% against 0.66-0.70% from mempool.space over 4320 blocks. So when you raise a discrepancy with a pool, state the source, the window and the date, or you will be arguing about figures computed under different rules.
Quiet fee markets do not last forever. On 20.04.2024, the day after the halving and the launch of Runes, fees reached 73.8-75% of miner revenue depending on methodology, and on 08.05.2023 at the Ordinals peak 40.8-42.59% for the day. On days like those the gap between FPPS and PPS stops being academic, which is a good moment to reread what your pool's documentation says about transaction fees.
What to check here:
- Which scheme the documentation actually names: FPPS, PPS+ or PPS. One word apart in text, percentage points apart in money.
- Whether the pool publishes the window it averages the fee share over.
- Whether the fee component of your credit matches the public fee share for those dates, at least in order of magnitude.
What else is deducted besides the pool fee?
Four mechanisms: the network fee on the payout transaction, the minimum payout threshold, rounding on credits, and the spread on any conversion. None of them is cheating, all of them are documented at least by some pools, and together they explain most cases where the amount that arrives is smaller than expected.
| Deduction | How it works | Verified examples |
|---|---|---|
| Network fee | Either taken out of your payout or paid by the pool | Luxor: 0.000075 BTC paid by the user, making the real threshold 0.001075 BTC. EMCD Terms of Service: the party paying the remuneration pays the fee, meaning the service does |
| Payout threshold | Funds sit with the operator until the balance clears it | Luxor 0.001 BTC, F2Pool 0.005 BTC per its official table, ViaBTC 0.001 BTC on auto-withdrawal, EMCD 0.0001 BTC per its help center while another official source of the same domain says 0.001 BTC, Ocean 0.01048576 BTC per secondary reviews |
| Withdrawal threshold as distinct from the credit threshold | Two different numbers, easy to conflate | NiceHash: 0.00001 BTC to the balance, but withdrawals start at 0.0005 BTC with a fee from 0.0001 BTC |
| Conversion spread | Officially not a fee, economically a deduction | Kryptex App documents a bid-ask spread between the average rate and the purchase rate but publishes no number. EMCD mentions autoconversion without publishing a rate |
Flat withdrawal fees deserve their own note, because they become a percentage that depends on the amount. Kryptex App charges 0.00003 BTC on chain against a 0.00025 BTC minimum, which is 12% of the smallest possible withdrawal and 0.3% on a 0.01 BTC one. Lightning on the same service costs 2% with a 0.00001 BTC minimum: cheaper in absolute terms, more expensive as a rate.
How long your money sits on the operator's balance is simple arithmetic. On network parameters from 09.09.2026:
| Miner hashrate | Threshold 0.0001 BTC | 0.001 BTC | 0.005 BTC | 0.01 BTC |
|---|---|---|---|---|
| 100 TH/s, typical home ASIC | about 2.1 days | about 20.8 days | about 104.2 days | about 208.3 days |
| 1 PH/s | about 5 hours | about 2.1 days | about 10.4 days | about 20.8 days |
That is an expectation calculation on 943.73 EH/s network hashrate and a 3.1459 BTC effective reward, not pool data. PPLNS and TIDES variance is not built into it.
For F2Pool and ViaBTC the rule does exist in the official help center, and it favors the miner.
F2Pool states on its help page that it charges no transaction fee for paying out mining revenue once the balance exceeds the minimum threshold. That threshold for BTC is 0.005 BTC per the pool's own table and is user-adjustable. The separate case is a manual withdrawal below the threshold: it is available from 10% of the default value, that is from 0.0005 BTC, it goes over Lightning only, and there the 0.000001 BTC fee is paid by the miner. The pool spells out the opposite rule for ETHW and ALEO, which does not apply to bitcoin.
ViaBTC puts it even more plainly: auto-withdrawal above the minimum is described in the help center as entirely free, and an announcement in the same section says the pool continues to cover all transaction cost. The BTC auto-withdrawal minimum is 0.001 BTC. The one place without clarity is the manual Normal Transfer: the official FAQ admits the fee for it floats with network congestion, but the page does not say who pays it. We will not guess on the pool's behalf, so check the amount on the withdrawal screen before confirming.
Three links verify all of this: the F2Pool help article on payout fees, the ViaBTC page on setting up auto-withdrawal and the ViaBTC deposit and withdrawal FAQ. Accessed 2026-09-11.
Which discrepancies are actually worrying?
The ones variance does not explain and time does not erase. A single bad week on PPLNS, a 3% daily shortfall on FPPS, a five minute hashrate dip on the dashboard: noise. A shortfall that persists across a month after you recomputed the expectation on the correct network parameters for each date: a signal.
| Observation | Concern level | Ordinary explanation |
|---|---|---|
| Dashboard hashrate 2-5% below the machine | Low | Averaging window, rejected shares |
| Dashboard hashrate 10%+ below for a month | High | Not explained by normal behavior, take it to support |
| 80% luck for a week on FPPS | None | Does not affect your payout |
| Luck persistently under 100% for a quarter on PPLNS | Medium | Could be variance, verify block counts against explorers |
| 1-3% monthly shortfall against your calculation | Low | Your input data carries about that much error anyway |
| Over 10% shortfall in 30 days on FPPS | High | The scheme does not produce that spread |
| Pool's blocks absent from public tables | High | Possible without a coinbase tag, but needs a clear answer |
| Pool's explorer share far below its stated hashrate | High | A claim about its own capacity with nothing behind it |
| Support ignores a written request containing a calculation | High | A sound operator answers numbers with numbers |
| One payout arrived late | Low | Happens with mempool congestion or address rotation |
| Payouts slip regularly with no explanation | Medium | Historically an early symptom of operator cash problems, not an arithmetic error |
That last row is worth taking seriously on its own. What happens to a balance when a pool stops entirely is covered separately in the article on a pool shutting down.
The 30 day checklist
This sequence covers everything above and needs nothing beyond access to your machines, your pool account and a browser.
- Day 0. Record the inputs: hardware model and count, nameplate hashrate, payout scheme, stated fee, payout threshold, payout address. Screenshot the pricing page rather than copying the number. Pages change quietly.
- Day 0. Set up local hashrate logging from the machines themselves. Without it you will be checking pool data against pool data. Minimum viable monitoring and alerting is covered in a separate article.
- Daily. Write down four numbers: daily hashrate per your machines, daily hashrate per the dashboard, the credit for the day, the reject rate.
- Daily. Record network hashrate and the transaction fee share for that same date. One snapshot for the whole month will skew the result: the network added 5.2% in eleven days at the end of August 2026.
- Weekly. Compare the pool's block count in public tables with the count in its own report.
- Weekly. Check every arriving payout in an explorer: transaction amount, amount debited from the balance, network fee, and who paid it.
- Day 30. Sum the daily expectations and the actual credits, then express the gap as a percentage.
- Day 30. Separately compute the difference between what was credited and what reached your wallet. Everything that went missing between those two figures should be explained by the threshold, the network fee or a conversion.
- Day 30. Judge the percentage against your scheme. On FPPS a monthly gap above 10% needs an explanation. On PPLNS, extend the window to a quarter before concluding anything.
- Day 30. If the gap survives that, go to the next section rather than to a chat room.
What to do when the discrepancy holds up
Open a support ticket made of numbers, dates and one question. Not of the sentence "you are stealing from me". An operator who answers this kind of request will answer yours, and one that ignores a written 30 day calculation has already told you something.
What to attach:
- The comparison period with exact dates, plus your login or worker IDs.
- A daily table: your hashrate, dashboard hashrate, credit, reject rate.
- The expectation calculation with the formula and the source of network parameters for each date.
- The total gap in BTC and in percent.
- The list of payout transactions with hashes and amounts.
- One specific question. For example: what accounts for the gap between credited and expected earnings over this period at this hashrate under this scheme.
Then read the answer. A breakdown of your numbers, a pointer to a documented rule, or an acknowledged incident with a recalculation are all workable outcomes. Generic talk about network volatility and variance, offered with no figures in response to a table full of them, is a bad sign, particularly the second time.
When switching pools is the right call:
- The gap held over 30 days and went unexplained after two requests.
- Payout delays became systematic.
- The pool stopped appearing in public block tables, or its share diverges wildly from its claims.
- Terms changed retroactively with no notice.
Moving costs money: a couple of hours of downtime, a forfeited PPLNS window on the old pool, and a sub threshold balance that may simply stay there. The rule that a below threshold balance accumulates rather than expiring is officially confirmed for F2Pool, ViaBTC and Luxor. For other pools we found no explicit statement either way, so treat it as an open question before you leave. Keeping a backup pool configured in the ASIC slots turns the switch into a few minutes of work, which is covered in the article on failover. Compare terms before you move in the pool comparison table.
What this method does not do
It does not prove fraud and it does not replace an audit. It tells you whether a gap exists between what you can compute yourself and what you were credited. Everything after that is a conversation with an operator, not a legal case.
Still unconfirmed in our own data as of 2026-09-11:
- Exact fee rates at AntPool, Binance Pool, Foundry USA and Braiins. Official pages either fail to load, do not publish a number, or contradict other sources.
- Withdrawal fees and the "who pays the network fee" rule at F2Pool and ViaBTC.
- Autoconversion spread rates at EMCD and Kryptex.
- Ocean's payout threshold: the 0.01048576 BTC figure comes from secondary reviews and was not confirmed directly by official documentation.
- The exact live hashprice on the publication date. Reading the number straight off the Luxor index did not work: the page renders through script and the cache serves values that are plainly stale. Per dated reprints of Hashrate Index data for 2026-09-05 and 2026-09-08, hashprice held around 39 to 40 USD per PH/s per day, that is roughly 0.039 to 0.040 USD per TH/s. One review dated 2026-09-06 puts it in the mid thirties instead, which does not reconcile with the other three sources. That is enough for orientation, but for a shutdown calculation look the value up yourself on the day you run the numbers. For context, per the published Luxor monthly reviews the six-month low is 27.74 USD per PH/s per day on 2026-06-06 and the high is 40.02 USD on 2026-08-27.
The short version
Blocks, the fees inside them, payout transactions and your own hashrate are verifiable. The internals of a PPLNS window and a pool's true capacity are not, and explorer block share is only a proxy for the latter.
Compute your expectation against network parameters for each date rather than a month old snapshot. On FPPS the credit line should be flat, on PPLNS judge over a quarter, and on FPPS luck has nothing to do with your payout.
Look for the missing money in the deductions first. Thresholds, network fees, separate withdrawal minimums and conversion spreads explain most of the "less arrived than expected" cases. Only when a gap survives 30 days and a recalculation should you open a ticket, and then open it with a table.