
Best ASIC miners in 2026: a ranking by efficiency and net income, not by hashrate
*Last updated: 07.09.2026. Written by the POOL BTC editorial team.*
POOL BTC takes no hashrate and pays nobody a reward. It is a comparison site for pools, calculators and mining hardware, and this ranking looks at other people's machines from the outside. Nothing here is sold, and there are no affiliate links to any vendor in the text.
Almost every "best ASIC 2026" list you can find is sorted by terahashes. That column is the easiest one to fill and the least useful one to read. The chain does not pay more per terahash to a bigger box, so a ranking by TH/s is a ranking by how much electricity a machine can convert, not by how much money it leaves you. What follows sorts the same models by joules per terahash and by net income after power, which reorders the list in ways that surprise people.
The short version
- One terahash paid about $0.030687 a day after a 2% pool fee on our 14.08.2026 network snapshot. No model gets a private rate. The machine only decides how many terahashes you contribute and what the utility charges you for them.
- Break-even efficiency is one line of arithmetic: `W/TH <= rate per TH / (0.024 x tariff)`. That gives 25.57 W/TH at $0.05 per kWh, 15.98 at $0.08, 12.79 at $0.10 and 10.65 at $0.12.
- Above the ceiling, hashrate stops helping. The 230 TH/s WhatsMiner M56S++ ranks third on gross revenue in our dataset and ninth on net income at $0.05.
- Hashprice moves every model's break-even tariff at once. On a HOGE Wire calculation dated 21.08.2026, the Antminer S21 XP breaks even at $0.117 per kWh at a $38 hashprice and only $0.098 at $31.89.
- Luxor's own ASIC Price Index groups machines into efficiency bands rather than by model. The current API schema has five: under 19 J/TH, 19 to 25, 25 to 38, 38 to 68 and above 68. The industry that trades these boxes prices them by J/TH, which is a reasonable hint about how to rank them.
- Pool fees barely register next to power. The spread from a 1% pool to a 4% pool is about nine cents a day on 100 TH/s. Moving the same S21 XP from $0.05 to $0.08 per kWh costs $2.62 a day.
Run a specific machine against your own tariff in the mining profitability calculator, and pull per model specs from the ASIC profitability ranking.
Where the numbers come from
Three of our own research passes and two external price samples, each with a date attached.
Ours: the 14.08.2026 network snapshot (933.99 EH/s, difficulty 127,479,855,693,691, a 3.125 BTC subsidy, BTC at $64,558), the pool fee and threshold check of 29.08.2026 (896.89 EH/s, difficulty 125,807,076,547,197.5, BTC around $77,817), and the cooling and tariff research of 02.09.2026.
External: a retail price list published by OneMiners on 20.08.2026, a break-even calculation published by HOGE Wire on 21.08.2026 at a $38 hashprice, the Bitdeer SEALMINER shop and press specs as of 01.09.2026, and eBay completed-sale medians from ING Mining for the window 15.05.2026 to 14.08.2026.
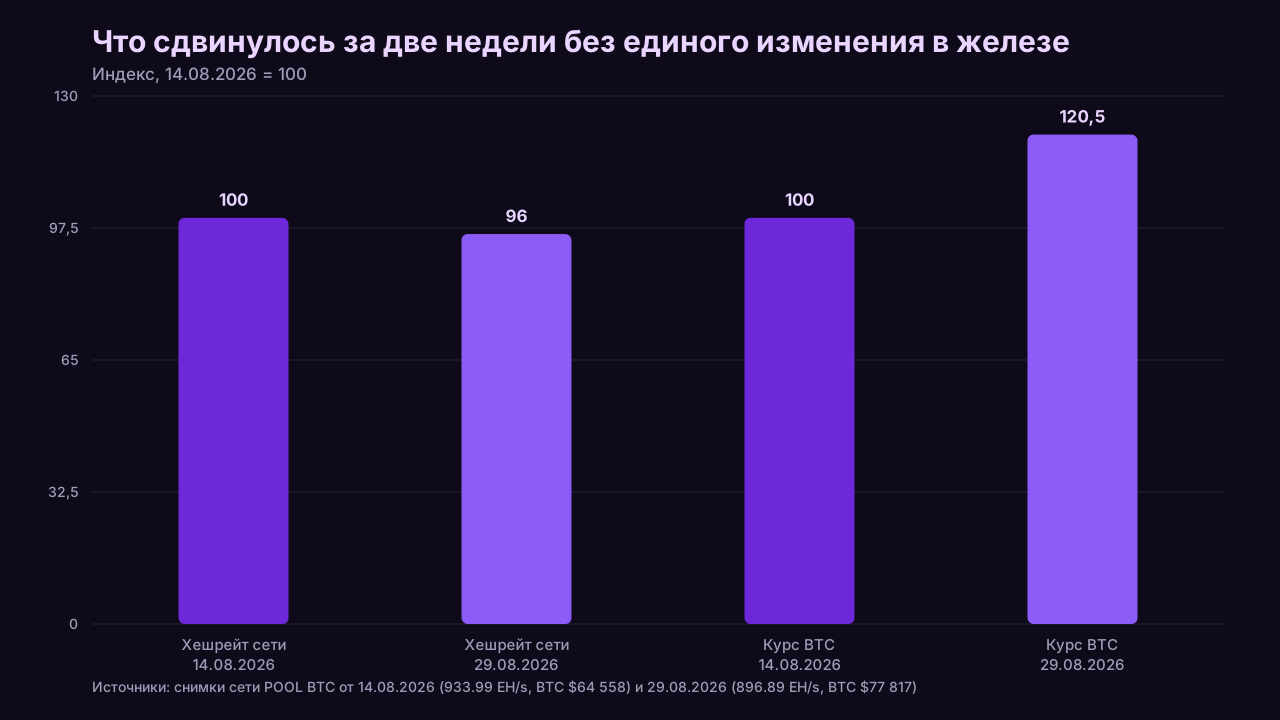
Two warnings about all of it. First, the 14.08 snapshot has BTC at $64,558, and by 29.08 the price had moved to roughly $77,817, about 21% higher, while network hashrate fell about 4%. Every dollar figure below is a photograph of one day, not a forecast. Second, the per terahash rate needs replacing on the day you read this, which is a two minute job on the network difficulty page.
Why J/TH beats TH/s as a ranking metric
Because revenue per terahash is identical for everyone on the network, while cost per terahash is not. Bitcoin pays for a share of total hashrate, so two machines with the same TH/s earn the same gross regardless of brand. What separates them is watts. Efficiency in joules per terahash is the only spec that changes the bottom line.
Put the two metrics side by side and the difference becomes obvious. Hashrate sets the size of your position. Efficiency decides whether that position survives your electricity bill. A big inefficient machine does not lose money slowly. It loses money faster than a small inefficient one, because it burns more kilowatt-hours doing it.
The market already agrees, which is the part most listicles miss. Luxor's Hashrate Index publishes a Bitcoin ASIC Price Index that sorts machines into efficiency buckets and quotes dollars per terahash inside each bucket. The blog post announcing an expansion of the index describes four bands (under 25, 25 to 38, 38 to 68, over 68 J/TH), and the current API schema at docs.luxor.tech carries five fields, adding an "under 19" band for the newest generation. Both states are real, just from different points in the index's history. The dollar values by date sit behind an interactive request and a keyed API and are not publicly indexed, so we are not reproducing them.
A second piece of evidence for the same point, from ELEKTRON's ASIC price index built on Luxor data: an efficiency of 40 J/TH cost over $50 per terahash in 2019, when it was top of the market, and the same 40 J/TH class traded at $2 to $3 per terahash in 2024. The hashrate did not change. The efficiency class did not change. What changed was where that class sits relative to everything else on the network.
The ranking by net income, 14.08.2026 snapshot
Gross means revenue after a 2% pool fee and before electricity. Sorted by the $0.05 column.
| Model | TH/s | J/TH | Gross $/day | $0.05 | $0.08 | $0.12 |
|---|---|---|---|---|---|---|
| Antminer S21 XP | 270 | 13.5 | 8.29 | +3.91 | +1.29 | -2.21 |
| Antminer S21 Pro | 234 | 15.0 | 7.18 | +2.97 | +0.44 | -2.93 |
| Antminer S21 | 200 | 17.5 | 6.14 | +1.94 | -0.58 | -3.94 |
| WhatsMiner M60S | 186 | 18.5 | 5.71 | +1.58 | -0.90 | -4.20 |
| Avalon A1566 | 185 | 18.5 | 5.68 | +1.57 | -0.89 | -4.18 |
| Antminer T21 | 190 | 19.0 | 5.83 | +1.50 | -1.10 | -4.57 |
| Avalon A1466I | 170 | 19.5 | 5.22 | +1.24 | -1.15 | -4.33 |
| WhatsMiner M60 | 172 | 19.9 | 5.28 | +1.17 | -1.29 | -4.58 |
| WhatsMiner M56S++ | 230 | 22.0 | 7.06 | +0.99 | -2.66 | -7.51 |
| WhatsMiner M50S++ | 160 | 22.0 | 4.91 | +0.69 | -1.85 | -5.23 |
| Antminer S19 XP | 141 | 21.5 | 4.33 | +0.69 | -1.49 | -4.40 |
| Avalon A1366 | 130 | 25.0 | 3.99 | +0.09 | -2.25 | -5.37 |
| Antminer S19j Pro | 104 | 29.5 | 3.19 | -0.49 | -2.70 | -5.64 |
| iPollo B2 | 110 | 29.5 | 3.38 | -0.52 | -2.85 | -5.97 |
| WhatsMiner M53 | 226 | 29.0 | 6.94 | -0.93 | -5.65 | -11.94 |
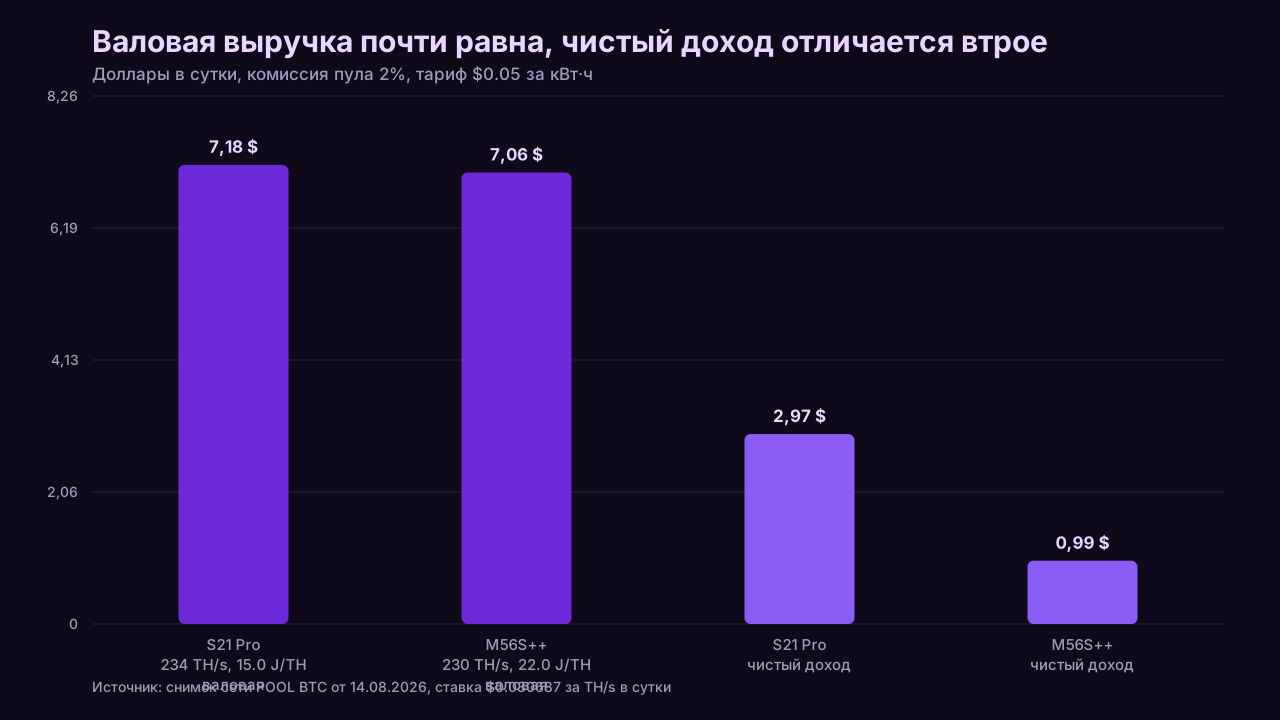
Read the M56S++ row against the S21 Pro row. The M56S++ has nearly the same hashrate as the S21 Pro and produces nearly the same gross, $7.06 against $7.18. On net at $0.05 the gap opens to three times. At $0.08 one is positive and the other is losing $2.66 a day. A ranking by TH/s would have put them next to each other.
The M53 is the same lesson in a harsher form. At 226 TH/s it out-hashes almost everything on the list, and it is the worst machine here at every tariff, including the cheap one.
How to compute net income for one specific miner
- Take rated TH/s and J/TH for the model from the ASIC profitability ranking, then check them against the manufacturer's own spec page rather than a retailer's card.
- Measure wall power with a plug-in meter once the machine is warm. Rated power is a starting estimate, and the number on the socket is the one you pay for.
- Daily revenue: TH/s multiplied by the current per terahash rate. On our 14.08.2026 snapshot that rate was $0.030687 a day after a 2% pool fee.
- Daily consumption: kilowatts at the wall multiplied by 24. If the machine sits on a site with shared cooling, multiply again by the site PUE.
- Find your all in tariff. Divide the invoice total by the kilowatt-hours billed in the same period. The advertised rate per kilowatt-hour is almost never the number you actually pay, and the full method is in mining electricity cost.
- Daily cost: consumption multiplied by the all in tariff.
- Net income: revenue minus cost. Do this for every model on your shortlist at the same tariff and sort the results. That sorted list is your ranking, and it will not match anybody's published one, because the tariff column is yours.
- Repeat after the next difficulty retarget. Retargets land every 2016 blocks, roughly every two weeks, so an estimate older than a fortnight is not an estimate.
Do not run this on a single day of pool payouts either. PPLNS pools swing day to day, and solo swings far harder. Take the seven day average from your own payout history where you have one.
What does the break-even electricity price mean for each model?
It is the tariff at which a machine's daily revenue exactly covers its daily power cost, leaving nothing for hardware, hosting or repairs. Above that price the machine loses money every hour it runs, regardless of hashrate, pool or firmware. Each model has its own break-even price, set almost entirely by its efficiency.
HOGE Wire published a break-even table on 21.08.2026 at a hashprice of about $38 per PH/s per day, with a second column at a previous hashprice of $31.89. Same machines, two market states:
| Model | J/TH | Break-even at $38 hashprice | Break-even at $31.89 hashprice |
|---|---|---|---|
| Antminer S21 XP | 13.5 | $0.117/kWh | $0.098/kWh |
| Antminer S21 Pro | 15.0 | $0.106/kWh | $0.089/kWh |
| WhatsMiner M60S | 18.5 | $0.086/kWh | $0.072/kWh |
| Antminer S19 XP | 21.5 | $0.074/kWh | $0.062/kWh |
| Antminer S19j Pro | 29.5 | $0.054/kWh | $0.045/kWh |
Two readings of that table. Vertically, the spread between the best and the worst machine is more than double, and it maps to efficiency alone. Horizontally, a 19% move in hashprice moved every ceiling by roughly the same 19%, which is why a ranking published at one hashprice cannot be trusted at another.
For context on where hashprice sat around those dates: Hashrate Index put spot hashprice at $31.73 per PH/s per day on 10.08.2026, with seven day average network hashrate at 911 EH/s.
Why the same miner ranks differently at $0.05 and $0.10 per kWh
Because revenue is fixed per terahash and cost is not. Doubling the tariff doubles only one side of the subtraction. Machines close to the ceiling flip sign, machines well under it merely lose margin, and the sorted order changes as a result. The ceiling itself halves: 25.57 W/TH at $0.05 becomes 12.79 W/TH at $0.10.
Work the ceiling formula both ways and the point lands. At $0.05 per kWh, `0.030687 / (0.024 x 0.05)` gives 25.57 W/TH, which covers twelve of the fifteen models in the table above. At $0.10 the same formula gives 12.79 W/TH, and not one model in that dataset clears it. The most efficient production machine we track runs at 13.5.
That is worth sitting with for a moment. At a tariff many households in Europe would consider cheap, the entire retail fleet of August 2026 was underwater at that snapshot's hashprice. Not most of it. All of it. This is also why "best ASIC" lists that publish a single profit column are close to useless: the column is only true for whoever wrote it.
It cuts the other way too. Under $0.03 power the ranking flattens out, because almost everything is profitable and the differences shrink to cents. Cheap power forgives inefficient hardware, which is exactly why old machines migrate to cheap regions instead of the scrapyard.
Air, hydro and immersion: what actually changes in the numbers
Three things change, and only one of them is efficiency. Cooling changes the density you can run per chassis, the site overhead you pay on top of the machine, and the price per terahash you pay at purchase. The J/TH of the chip itself barely moves.
Bitdeer's own catalogue is the cleanest evidence available, because the company sells air and hydro versions of the same chip generation and publishes both spec sheets. As of 01.09.2026:
| Model | TH/s | Watts | J/TH | Listed price |
|---|---|---|---|---|
| SEALMINER A3 Pro Hydro | 660 | 8250 | 12.5 | $9,900 list, $9,478 discounted |
| SEALMINER A3 Pro Air | 290 | 3625 | 12.5 | not published, pre-order |
| SEALMINER A3 Hydro | 500 | 6750 | 13.5 | $6,750 list, $6,411 discounted |
| SEALMINER A3 Air | 260 | 3640 | 14.0 | not published, pre-order |
| SEALMINER A4 Ultra Hydro | 886 | 8372.7 | 9.45 | not published, pre-order |
| SEALMINER A4 Pro Hydro | 680 | 7412 | 10.9 | not published, pre-order |
| SEALMINER A4 Pro Air | 336 | 3662.4 | 10.9 | not published, pre-order |
Look at the A4 Pro pair. Hydro and air, identical 10.9 J/TH, and the hydro box carries roughly twice the hashrate in the same rack space. Efficiency did not improve. Density did. That distinction is missing from most hydro marketing, and it matters because density is worth money only when floor space or hosting slots are your constraint. A full read of Bitdeer's hardware line and its numbers is in the Bitdeer review.
Where cooling does reach the arithmetic is site overhead, measured as PUE, the ratio of total site power to the power reaching the machines. From our 02.09.2026 research:
| Cooling | Typical PUE | Source status |
|---|---|---|
| Air-cooled mining hall | 1.10 to 1.50, down to 1.05 to 1.10 with hot aisle containment | d-central.tech and rax.ae, mining specific figures |
| Container | 1.02 to 1.10, best in class 1.01 to 1.03 | rax.ae data centre type table |
| Single phase immersion | 1.03 to 1.10 | Green Revolution Cooling published a Texas case study at 1.03 |
| Two phase immersion | 1.01 to 1.05 | LiquidStack vendor datasheet, pPUE 1.02 |
An academic review in Energy Informatics (Haghshenas et al., 2023) puts immersion at 1.02 to 1.04 across lab studies, with one 2014 study reporting up to 1.17. The same review gives much worse air numbers, 2.2 to 2.61, but those describe general purpose enterprise data centres with raised floors and chillers, not mining halls. For a mining decision, use the mining specific figures.
Practical translation: moving from a 1.30 PUE hall to a 1.05 immersion setup cuts about 19% off the power you pay per terahash mined. That is real, and it is nowhere near the size of the gap between a 13.5 J/TH machine and a 29.5 J/TH one. Cooling optimises the margin you already have. It does not rescue an obsolete chip.
For a home miner, PUE mostly does not apply. There is no separate cooling circuit to measure, the ASIC's own fans are already inside its rated draw, and in winter the exhaust may be replacing heating you would have paid for anyway, which makes the formula produce values below 1.0 that the definition does not allow. The practical home method is the delta between the wall meter and the machine's own telemetry.
Purchase price is the third variable. From the OneMiners retail list of 20.08.2026, which is one retailer rather than a market index: the S23 Hydro at 580 TH/s and 9.5 J/TH was $14.1 per terahash, the S21 XP Hydro at 473 TH/s and 12.0 J/TH was $20.1 per terahash, and the air-cooled S21 XP at 270 TH/s and 13.5 J/TH was $25.2 per terahash. Hydro was not carrying a premium per terahash in that list. It was cheaper per terahash and much more expensive per box, $9,500 against $6,800, plus a cooling loop you have to build.
One caveat on that same list, from our own news log: the S23 Hydro appeared at $12,299 in a catalogue snapshot on 12.08.2026 and at $8,200 in the 20.08.2026 ranking, with no explanation from either source. Treat retail prices as an order of magnitude.
New or used: how residual value reshuffles the ranking
A used machine can outrank a new one on the metric that matters to a buyer, which is payback, without ever outranking it on efficiency. Purchase price is the numerator and daily net margin is the denominator, so a machine at a third of the price with half the margin still pays back sooner. Efficiency decides the ceiling. Price decides the queue below it.
Two rows from our sources make the point. The Antminer S19 XP has a median completed eBay sale price of $298 across 34 units for the window 15.05.2026 to 14.08.2026, and it earns $0.69 a day at $0.05 per kWh on our snapshot. The S21 XP earns $3.91 a day at that tariff and was listed at $6,800 new by OneMiners. That is 5.7 times the daily margin for roughly 23 times the money. At $0.05 per kWh the older machine is the faster payback. At $0.08 it is losing $1.49 a day and the comparison stops existing.
That flip is the entire second-hand market in one sentence. Used hardware wins on cheap power and dies first on expensive power. The full pricing method, the inspection checklist and the eBay medians for nine models are in what a used ASIC is really worth, which also covers why the depreciation curve is not a straight line.
Worth adding here: not every model falls. In the same eBay dataset the Canaan Avalon Q at 90 TH/s had a median of $1,100 across 35 units and rose from $827 in April 2026 to about $1,075 in August. The assumption that used ASICs only ever get cheaper breaks on a specific machine.
An independent review, noxhash, estimates that a flagship loses 50% to 70% of its dollars per terahash in the first 18 months and another 30% to 50% over the following two years, with the fall accelerating sharply in the 60 days after the next generation is announced. That is a secondary reconstruction rather than an index reading, so treat it as a shape and not a number.
What difficulty and hashprice growth do to the ranking over a year
They move every model's break-even ceiling together, which changes who is above the line without changing the order. Difficulty growth pushes ceilings down, price growth pushes them up, and the two often cancel. The models that flip sign are the ones already sitting closest to the line, so the bottom of any ranking is the volatile part.
The arithmetic on retargets is simple and unforgiving. Revenue is inversely proportional to difficulty, so a rise of X costs you X / (1 + X) of your income. A 5% retarget takes 4.76%. A 2% retarget takes 1.96%. Revenue slips by a few percent and net margin slips by much more, because the power bill does not retarget alongside the network.
Which means a common mistake in year long projections is multiplying today's daily net by 365. Sum fortnightly chunks with the net stepping down each time instead. The corrected method, including downtime, is in ASIC miner ROI.
Price pulls the other way, and it pulls hard. Between our 14.08.2026 and 29.08.2026 snapshots, BTC moved from $64,558 to roughly $77,817, about 21% up, while network hashrate fell about 4%, from 933.99 to 896.89 EH/s. In two weeks, both terms of the fraction moved in the miner's favour. Nothing about the hardware changed, and the whole ranking shifted upward.
Transaction fees are a rounding error at the moment and worth knowing about anyway. Over the 4,320 blocks ending 29.08.2026 they were 0.73% of total block reward, and 0.699% by the same method on 02.09.2026. In a quiet mempool that is noise. In a congested one it stops being noise, and it lands differently depending on your pool's rules, which the pool fee breakdown covers in detail.
The next halving sits at block 1,050,000, expected in April 2028. The block height is protocol, the date is an estimate, and public countdowns spread across roughly two weeks inside that month because they each assume a slightly different average block time. For ranking purposes the date barely matters. What matters is that a machine barely in the black today stays in the black after the subsidy halves only at roughly half the tariff.
Which spec numbers vendors quote optimistically
Four of them, in rough order of how often they mislead: chip efficiency quoted instead of machine efficiency, rated power instead of wall power, best case hashrate quoted without its tolerance band, and boosted firmware figures on refurbished units. None of these is fraud. All of them make a machine rank higher than it will in your building.
Chip against machine is the biggest gap and the easiest to check. Bitdeer publishes a SEAL chip roadmap on its own shop page listing SEAL04 at 6 to 7 J/TH for Q4 2025. The machine built on that chip, the A4 Ultra Hydro, is specified at 9.45 J/TH. Both numbers are the company's own and both are honest. They describe different objects. Whenever a marketing figure looks a full generation better than the catalogue, check whether you are reading a chip spec.
Tolerance bands come next. Bitdeer's A4 launch release states a spread of plus or minus 5% on power efficiency and plus or minus 10% on hashrate and power consumption, with final characteristics determined by the delivered units. A 10% swing on power at 8,372 watts is 837 watts, which is a meaningful line on a monthly bill. Most vendors publish something similar in the small print. Read it before you build a spreadsheet on the headline number.
Then there is the plain disagreement between sources on the same machine. The Antminer S21 Pro is listed at 15.0 J/TH in our own dataset and in the HOGE Wire break-even table, and at 15.5 J/TH in the OneMiners retail list of 20.08.2026. Half a joule is not much until you are comparing two models that sit a joule apart. We are not averaging the two.
Finally, wall power. An air cooled ASIC in a warm room draws above spec because its fans work harder, so summer and winter give different numbers on the same machine in the same socket. There is no way to guess this. A plug-in meter costs less than a day of mining and it settles the argument permanently.
How the pool payout scheme and fees move net income between identical machines
They move it less than most buyers expect, and the scheme matters more than the percentage. Two identical machines on two different pools differ by cents a day on fees, while the payout scheme changes the shape of the income rather than its expected size. Fees belong in the ranking, well below the tariff.
Real advertised rates from our 29.08.2026 check, with the verification status attached:
| Pool | Rate | Scheme | Verification |
|---|---|---|---|
| F2Pool | 4% FPPS, 2.5% PPS+, 2% PPLNS | three schemes | confirmed on the official help pages |
| ViaBTC | 4% PPS+, 2% PPLNS | hybrid, see below | confirmed on viabtc.com/en/pricing |
| NiceHash | 2% | RTPPS | scheme confirmed on the official blog, fee page did not open |
| EMCD | 4% for BTC | FPPS | partly confirmed, threshold sources contradict each other |
| Trustpool | 1% | PPS+ | not confirmed on this pass, figure from an old forum thread |
| Luxor | not published | FPPS | sources give both 0.7% and 2.5%, unresolved |
| AntPool | not published | FPPS, PPS, PPLNS | official page returned 403, sources conflict |
ViaBTC is the instructive row. The pool pays the block subsidy under PPS at 4% and distributes transaction fees under a PPLNS formula at 2%, so the "4%" on the pricing page describes half the structure. Verified against the official page on 01.09.2026. AntPool, by contrast, would not confirm anything at all on that pass, which is covered in the AntPool review.
Now the size of it. The whole spread from a 1% pool to a 4% pool is about nine cents a day on 100 TH/s. On the same hardware, one step up in tariff from $0.05 to $0.08 costs the S21 XP $2.62 a day, the difference between its $3.91 and $1.29 columns. Fees are two orders of magnitude smaller than power. Anyone ranking miners by which pool they will run on has the priorities backwards.
Where the scheme does bite is timing and variance. Under FPPS the pool absorbs luck and prices it into the rate. Under PPLNS the miner carries it, which is why PPLNS is cheaper, and why a machine moved between pools every few weeks will underperform its own ranking: you pay to spin the window up and never collect the tail. The mechanics of all six schemes, plus payout thresholds and network withdrawal fees, are in the pool fee breakdown.
A ranking you can rebuild in ten minutes
- Write down your all in tariff from last month's bill: total due divided by kilowatt-hours billed.
- Compute your break-even efficiency: `rate per TH / (0.024 x tariff)`. Anything above that number is off the list, whatever its hashrate.
- Take the surviving models and compute daily net for each at your tariff.
- Divide the purchase price you can actually get by that daily net. That gives payback in days for each candidate.
- Sort by payback, not by net income. A machine that earns more per day and costs four times as much is not automatically the better buy.
- Subtract shipping, duties, a PSU if it is not included and any electrical work from your budget before comparing prices, because those land on the numerator too.
- Apply a discount for difficulty growth over your horizon. Size it yourself, and make it larger for machines near the ceiling.
- Redo the whole thing after the next retarget.
Steps two through four are what the mining profitability calculator does, with the tariff and the machine as your inputs rather than someone else's assumptions.
FAQ
Which ASIC is the most profitable in 2026?
On our 14.08.2026 snapshot, the Antminer S21 XP: 270 TH/s at 13.5 J/TH, $8.29 gross and $3.91 net a day at $0.05 per kWh. At $0.08 it kept $1.29, and it was the only model with real headroom left. At $0.12 nothing in our dataset was positive. The answer changes with hashprice and with your tariff.
Is J/TH or TH/s the better metric for choosing a miner?
J/TH. Revenue per terahash is the same for everyone on the network, so hashrate only scales your position, while efficiency decides whether that position survives your power bill. Luxor's ASIC Price Index groups hardware into efficiency bands rather than by model, which is the trading market making the same choice.
Does hydro or immersion cooling make a miner more profitable?
Indirectly and modestly. Bitdeer's air and hydro versions of the same chip carry identical rated efficiency, 10.9 J/TH on both A4 Pro variants, so cooling buys density rather than J/TH. Where it does pay is site overhead: immersion runs at roughly 1.02 to 1.10 PUE against 1.10 to 1.50 for an air cooled hall.
How do I find the break-even electricity price for my machine?
Divide the daily revenue per terahash by the product of 0.024 and the machine's J/TH. At an August 2026 hashprice near $38 that gave $0.117 per kWh for a 13.5 J/TH machine and $0.054 for a 29.5 J/TH one, per the HOGE Wire calculation of 21.08.2026. Recompute whenever hashprice moves.
Should I buy new or used?
It depends on your tariff more than on the hardware. Under cheap power an older machine at a fraction of the price can pay back sooner despite a thinner margin. Above roughly $0.07 to $0.08 per kWh the old generation goes negative and price stops mattering. The pricing method is in what a used ASIC is really worth.
How often should this ranking be recalculated?
Every difficulty retarget at minimum, which is roughly every two weeks, and the same day after a sharp move in price or tariff. The numbers here are dated snapshots and they expire along with the network parameters behind them.
Where to go next
Model specs and current per model figures: ASIC profitability ranking. A calculation against one specific machine, price and tariff: mining profitability calculator. Working out your real cost per kilowatt-hour: mining electricity cost. What a pool actually deducts on top of the advertised rate: pool fee breakdown. Pricing a used machine and inspecting it before payment: what a used ASIC is really worth. Payback with downtime and difficulty corrections: ASIC miner ROI. Live network state: difficulty and hashprice.
This article contains referral links to mining pools (marked as sponsored). We may receive a reward if you register through them. This does not change the figures or the order of rows in the tables: the terms are taken from the pools' official pages.