
ASIC undervolting: when cutting clocks adds net income, and when it just costs you hashrate
Every undervolting thread starts with the wrong question. People ask how much hashrate they will lose. The number that decides the outcome is a different one: what price the machine charges you for its last terahashes. If the top few percent of hashrate cost more in watts than the network pays for them, you are better off not buying them. If they cost less, every step down the curve takes money out of your pocket.
The line between those two cases fits on one line of arithmetic, and it moves with your electricity tariff and nothing else. Below is the derivation, the threshold worked out across a range of kWh prices, and the parts nobody quantifies: shares, pool payouts, cooling, warranty.
POOL BTC does not accept hashrate and pays nobody a reward. We compare other people's pools and run the economics from the outside, so there is no "flash this firmware" recommendation anywhere in this text. Where we could not confirm a number, there is a marker saying exactly what needs checking. We are not going to invent firmware specifications.
What J/TH means and why it becomes the deciding number on expensive power
J/TH is joules per terahash, the energy a machine spends per unit of work. Numerically it equals watts divided by terahashes per second. The network pays every participant the same rate per terahash, so hashrate sets your revenue and J/TH sets your cost. On expensive electricity the second number decides the sign of the result and the first one only its size.
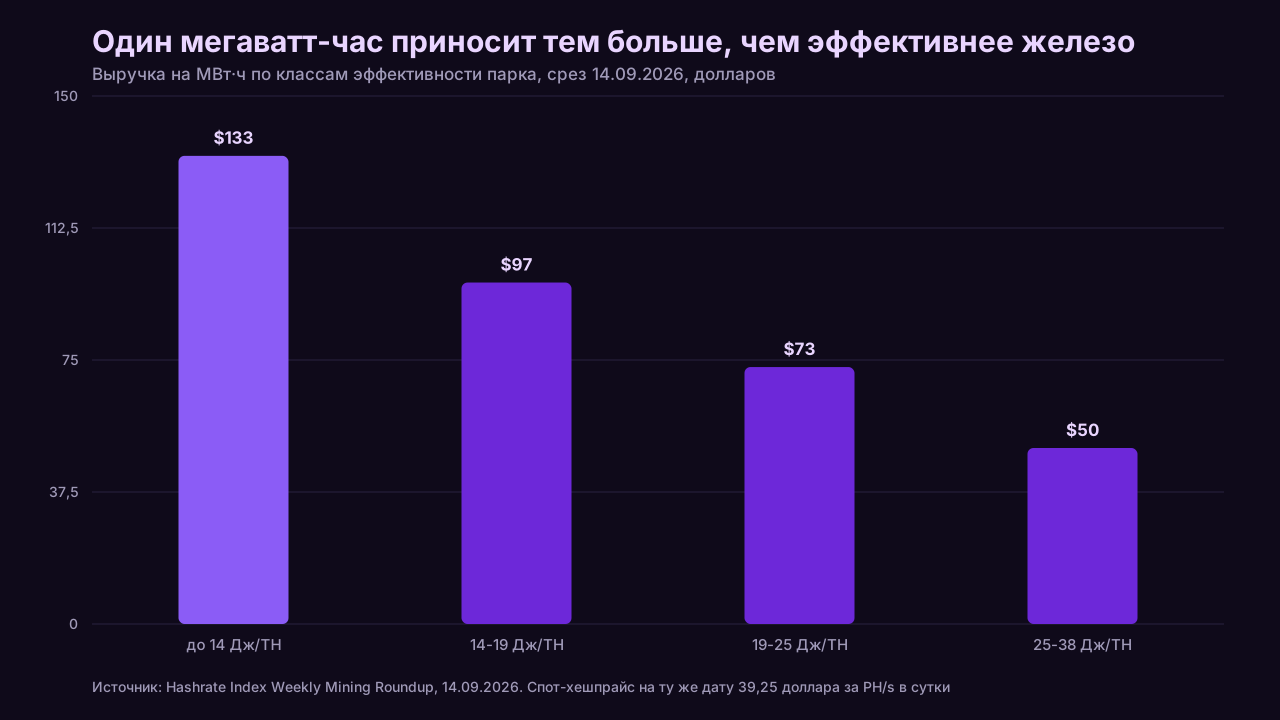
The clearest way to see it is to flip the calculation and price a megawatt-hour instead of a machine. You buy energy, not terahashes. The Hashrate Index weekly roundup dated 14.09.2026 publishes revenue per megawatt-hour by fleet efficiency class: $133 for fleets under 14 J/TH, $97 for 14-19 J/TH, $73 for 19-25 J/TH and $50 for 25-38 J/TH. The same megawatt-hour earns 2.66 times more in the first row than in the last. The only difference is the efficiency of the hardware that consumes it.
The secondary market prices the same way. Luxor's ASIC price index sorts machines into efficiency buckets rather than model names, and the current API schema has five: under 19 J/TH, 19-25, 25-38, 38-68 and above 68. Which model sits inside the bucket is secondary for pricing.
What undervolting and underclocking actually do
Silicon draws power roughly in proportion to frequency and to the square of voltage. Drop the core voltage and power falls faster than hashrate, but stability margin falls with it: at lower voltage the chip stops computing reliably at the old frequency, so the clock has to come down too. That is why undervolting and underclocking travel together.
For the owner the result is simple. You had H1 terahashes at P1 watts, now you have H2 at P2, with H2 below H1 and P2 below P1. Average efficiency improved, absolute hashrate dropped, the power bill shrank. From there it is subtraction, and subtraction can land either way.
One distinction gets skipped and it is the one that matters: average efficiency and marginal efficiency are different numbers. Average is P2 divided by H2. Marginal is the price of the piece you threw away, (P1 minus P2) divided by (H1 minus H2). The decision is made on the marginal figure. The average is only useful for comparing machines against each other.
When undervolting raises net income and when it lowers it
Direct answer: undervolting pays exactly when the marginal efficiency of the hashrate you give up is worse than your break-even threshold in W/TH. That threshold depends only on the rate per terahash and your price per kilowatt-hour. Machine, firmware and pool brand do not appear in the comparison. They only decide what marginal efficiency you end up with.
The derivation is two lines. Daily net income equals H times R minus P divided by 1000, times 24, times C, where R is daily revenue per terahash after pool fee and C is your all-in tariff per kWh. Tuning changes income by the electricity saved minus the revenue lost, so it pays when
`(P1 - P2) / (H1 - H2) > R / (0.024 x C)`
On the left, marginal efficiency in W/TH. On the right, the threshold. That right-hand side is the same formula used to work out the whole-machine W/TH ceiling in our breakdown of ASIC rankings by efficiency and net income. Not a coincidence: it is one threshold, applied either to the entire machine or to its last terahashes.
The rule reads backwards too. Overclocking pays when the marginal efficiency of the hashrate you add is better than the threshold. On most ASICs that only holds on very cheap power, because the top of the frequency curve is the most expensive hashrate silicon sells.
How to work out your own threshold
The W/TH threshold is daily revenue per terahash divided by 0.024 times your tariff. The 0.024 is 24 hours divided by the 1000 watts in a kilowatt. On the Hashrate Index snapshot of 14.09.2026 spot hashprice is $39.25 per PH/s per day, which is $0.03925 per terahash before fees and $0.038465 after a 2% pool fee. That gives the table below.
| All-in tariff, $/kWh | Threshold, W/TH (same number as J/TH) | What it means for tuning |
|---|---|---|
| 0.03 | 53.42 | Tuning loses money almost always, nothing worth shedding |
| 0.05 | 32.05 | Pays only on the dirtiest top profiles |
| 0.068 (Kazakhstan, GPP, Dec 2025) | 23.57 | Borderline for 2024-generation hardware |
| 0.08 | 20.03 | Pays on most air-cooled machines |
| 0.10 | 16.03 | Below the 17.5 J/TH of an S21, above the 13.5 of an S21 XP |
| 0.12 | 13.36 | Below the rated efficiency of even an S21 XP |
| 0.1834 (US average, EIA, June 2026) | 8.74 | Below the 8.9 J/TH of the best Antminer announced |
The last two rows deserve a second read. The US average residential rate per EIA for June 2026 is 18.34 cents per kWh. The most efficient Antminer announced, the S23 XP Hyd shown by Bitmain on 28.08.2026, is rated at 600 TH/s and 5,340 W, which is 8.9 J/TH. A threshold of 8.74 W/TH sits below that. At that tariff and that rate per terahash the machine loses money as a whole, and tuning does not rescue it. It slows the bleeding; switching off stops it.
The rate per terahash is not a constant. On 14.09.2026 spot hashprice per Hashrate Index is $39.25 per PH/s per day, with a 30-day average of $38.04, against $31.89 on 17.08.2026, and difficulty holds at 127.45T. A caveat from the same window: trackers disagreed on network hashrate by a wide margin, from 934 EH/s at Hashrate Index and CoinWarz to 1130 EH/s at HTX Insights on 06.09.2026, so no single figure can be quoted. Recalculate the threshold on the day you read this, either by substituting a fresh rate into the same fraction or by pulling it from the mining profitability calculator.
There is a second way to see the same threshold, through break-even price. HOGE Wire published a table on 21.08.2026 at a hashprice around $38 per PH/s per day: Antminer S21 XP at 13.5 J/TH breaks even at $0.117/kWh, S21 Pro at 15.0 J/TH at $0.106, WhatsMiner M60S at 18.5 J/TH at $0.086, S19 XP at 21.5 J/TH at $0.074, S19j Pro at 29.5 J/TH at $0.054. Improving average efficiency moves a machine up that column. It also moves revenue down, so a better break-even price on its own is not proof of more money.
Stock power profiles versus custom firmware
Factory firmware on most current ASICs already switches between power profiles, and that is the cheapest way to test the idea. Custom firmware sells something else: autotuning that picks voltage and frequency per board or per chip rather than for the machine as a whole, working around the real spread in silicon quality and temperature.
| Option | What gets tuned | Cost | Risk |
|---|---|---|---|
| Stock power profiles | A few factory points, whole machine | Zero | Warranty intact, coarse steps |
| Custom firmware with autotuning | Voltage and frequency per board or chip, targeting power or hashrate | Dev fee of 1.5-3% of hashrate, or a one-off licence | Warranty loss, instability at aggressive targets |
You pay for that tuning in hashrate rather than from your account, and the rates differ widely.
| Firmware | Dev fee | What the vendor claims on efficiency | Model support |
|---|---|---|---|
| Braiins OS+ | 2-2.5% of hashrate, depending on the model | From 2% to 10% and above in the model table on the site; in testing supervised by TUV SUD (April 2025), 2.62% on an S19k Pro 120T and 12.47% on an S19j Pro 104T in power-target mode | The whole Antminer S19 and S21 line, Hydro and Immersion included; S17 and S9 frozen on their last builds |
| Vnish | 2.8% on SHA-256, 2% on Scrypt | "Around +20% hashrate on average versus the factory profile", with no separate J/TH figure published | 47 Antminer models in the official build catalogue dated 09.08.2026, plus L7 and L9 |
| LuxOS | 2.8% base rate, down to 1.90% by volume in contracts | 8.85% on an S21 Pro in the Balanced profile and 18.67% at underclock step -4; 11.01% and 15.41% on an S21 XP | Antminer S19 and S21, select WhatsMiner models since April 2026 |
| ePIC UMC OS | 1.5% since January 2026, or a one-off licence | The vendor publishes no separate efficiency-gain figure | Most air-cooled Antminer S19 and S21 variants |
| Hiveon ASIC | 1.8-3% by model, 2.7% from 50 units and 1.5% from 1,000 | The vendor publishes no separate efficiency-gain figure | S9, S17, S19, T17, T19, L3 |
Rates and model lists were checked against the vendors' own pages on 21.09.2026, and the LuxOS volume rates come from a contract addendum published in an SEC filing. The spread of claimed gains, from 2.6% to 18.7%, is not a spread in firmware quality but a spread in method: a lab test on one model, a marketing table and a customer case study are not comparable. There is no single industry number for the gain, and a vendor quoting one figure for an entire fleet is simplifying.
Warranty. The three manufacturers word it almost identically. Bitmain's After-Sales Maintenance Policy lists "unauthorized changes on firmware or hardware using any third party's product(s)" and failures "caused by the use of unauthorized firmware or drivers" among the grounds for refusal, and damage from third-party overclocking software falls into the category where even paid repair is declined. Canaan is the bluntest: the warranty is void if "the product has been modified or has non-official firmware installed". MicroBT lists "use of non-approved or unofficial software" and overclocking damage among its exclusions. One detail worth reading literally: at Bitmain and MicroBT the clause hangs on damage caused, not on the act of flashing, while at Canaan the act of installing is enough. In practice the difference rarely matters, because each of them also has a clause on unauthorised intervention that is enough on its own.
One thing worth settling before install rather than after: some firmware replaces the bootloader, and rolling back to factory stops being a ten-minute job. Our 09.09.2026 research into reject-rate norms separately notes that no public numeric threshold could be found from Braiins or Luxor, and firmware documentation looks much the same. Plenty of marketing pages, few reproducible numbers.
What undervolting does to stale and reject share
Direct answer: lower hashrate on its own does not change your reject share, because the pool counts valid and timely solutions, not watts. Instability does. Push the power target too far and chips start producing computation errors, so what used to be a valid share becomes garbage the pool will not accept.
Published norms differ noticeably between pools and there is no industry standard. From our check of 09.09.2026:
| Pool | What it publishes | Value |
|---|---|---|
| AntPool | Normal rejection rate | Under 1%, stale rate 0.5% or lower |
| ViaBTC | Normal rejection range | Within 3% |
| F2Pool | Reasonable range for delayed shares | Around 2% |
| Braiins, Luxor | Numeric norm | No public figure found |
A caveat on method: the support pages of AntPool, ViaBTC, F2Pool and Bitmain return 403 to automated requests, so those quotes come from search snippets rather than full page text, and no publication dates were found for any of them. The gap between 1% and 3% at two large pools is a genuine difference in approach, not a research error.
The practical consequence is easy. Your reference point is not some abstract number, it is the one your pool publishes. Record your reject share before the tune and after, and if it went outside your pool's stated range, the profile is too aggressive no matter what the wattmeter says. What sits behind a jump in rejects, and how to tell it apart from network trouble, is covered in the piece on rejected shares, while the case where your ASIC is not the culprit at all is in the breakdown of pool-side outages.
No vendor publishes a numeric relationship between undervolt depth and error rate. We went through the Braiins, Vnish, LuxOS, ePIC and Hiveon documentation on 21.09.2026: autotuning is everywhere described as a feedback loop that finds a stable point per chip on its own, but a curve of voltage against hardware error share exists at none of them, the logic being proprietary. Nobody will hand you the threshold where errors start climbing, so you have to measure it yourself: record hardware errors and reject share at every step down, and stop one step before the one where they start rising.
How payout scheme and pool fee change the result at lower hashrate
The pool fee barely participates in this decision. It multiplies revenue per terahash, so it shifts the threshold proportionally: at a pre-fee rate of $0.03925 per terahash per day and a tariff of $0.05, the threshold is 32.38 W/TH on a 1% pool and 31.40 W/TH on a 4% pool. About three percent apart, and it flips nothing. In money the gap between those two pools is roughly twelve cents a day per 100 TH/s, while moving the same S21 XP class machine from $0.05 to $0.08 power costs it $2.62 a day.
The payout scheme works differently, and it changes the speed of money rather than the amount:
- FPPS and PPS+ pay a fixed rate for accepted shares. Lower hashrate reduces the payout strictly in proportion, with no secondary effect.
- PPLNS pays a share of blocks the pool finds inside a window. The share is proportional too, but variance grows as your hashrate falls, and judging the result from a single day stops meaning anything.
- The minimum payout threshold does not move; you just take longer to reach it. Cutting hashrate by 10% stretches accumulation time by about 11%. At F2Pool's 0.001 BTC threshold, or Luxor's 0.001 BTC plus a 0.000075 BTC network withdrawal fee, that is noticeable. At NiceHash's 0.00001 BTC it is not.
- Fees differ by scheme inside the same pool. F2Pool charges 4% on FPPS, 2.5% on PPS+ and 2% on PPLNS; ViaBTC charges 4% on PPS+ and 2% on PPLNS (checked 29.08.2026).
If you tune the machine and switch pools in the same week, you will have one chart and two explanations for it. Separate the two changes in time. The mechanics of the schemes themselves are in the FPPS versus PPLNS comparison, and how we derive the rate per terahash behind these snapshots is in the methodology.
Immersion and cooling: how temperature changes achievable efficiency
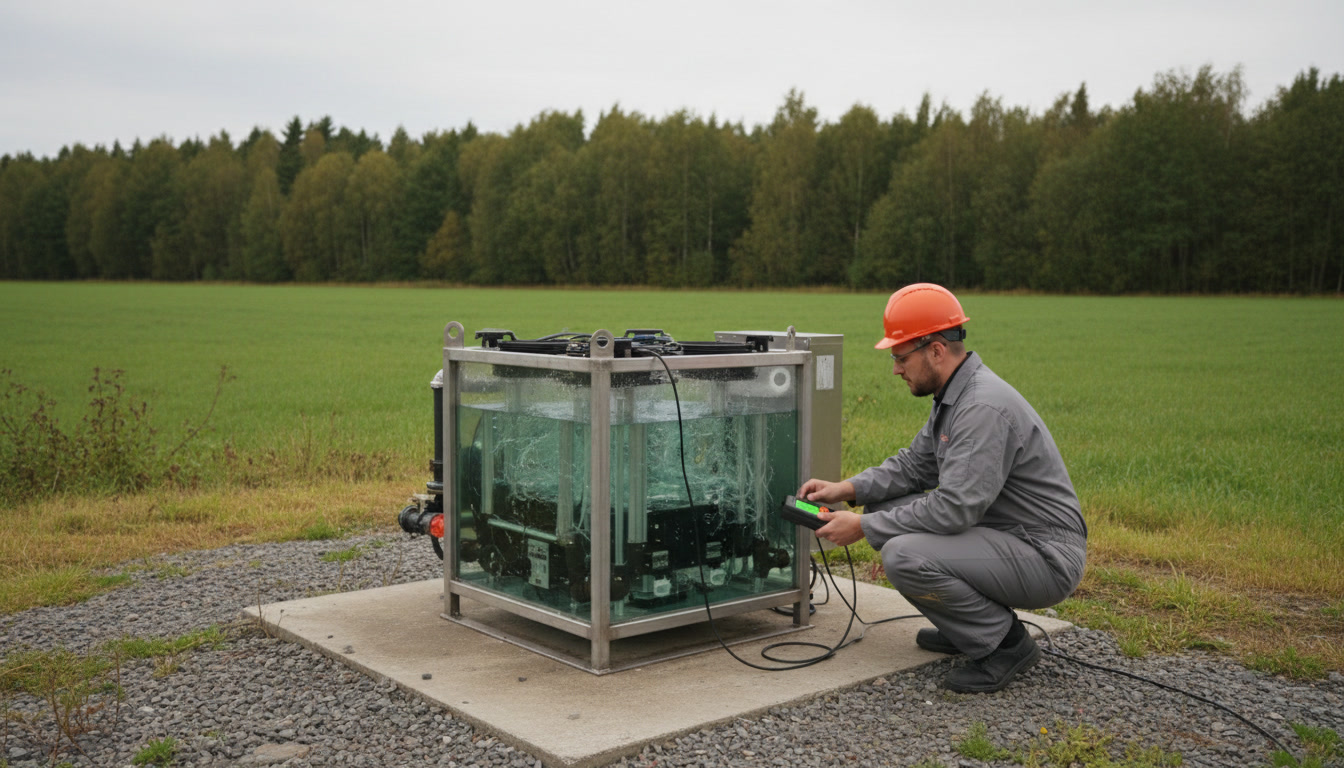
Direct answer: cooling does not change the physics of the silicon, it changes which profile stays stable on it. The cooler and steadier the chips, the lower the voltage at which they still compute without errors, and the deeper an undervolt you can hold. Separately, site cooling overhead disappears from the bill, and that part shows up on the meter rather than in miner telemetry.
The second effect is measured through PUE, the ratio of total site power to power reaching the miners. From our 02.09.2026 research the industrial reference ranges are: air-cooled mining hall 1.20-1.50, down to 1.10 with hot-aisle containment; container 1.02-1.10; single-phase immersion 1.03-1.10 (a published Green Revolution Cooling case in Texas gives 1.03); two-phase 1.01-1.05 (a LiquidStack vendor datasheet claims pPUE 1.02). An academic review in Energy Informatics converges on 1.02-1.04 for immersion, though one study inside it reports 1.17. We quote both rather than averaging them.
For a home setup PUE is usually not calculated at all. There is no separate cooling loop, the ASIC's own fans are already inside its rated power, and in winter the miner displaces electric heating, which breaks a formula that by definition cannot go below 1.0. The practical home equivalent is the delta between the wall meter and the miner's own telemetry.
What vendors do not publish is a figure for how much deeper an undervolt holds in immersion than in air on the same model. As of 21.09.2026 we found no such measurement with a stated method, neither from firmware vendors nor from dielectric fluid suppliers: Vnish goes no further than saying liquid-cooled and immersion machines usually see the largest gains, without a number, and percentages like "15-30% in immersion" appear only at third-party aggregators with no link to a specific test. The closest thing with rated numbers is the factory hydro variants: an Antminer S21 in air gives 200 TH/s at 3,500 W, or 17.5 J/TH, while the S21 Hyd gives 335 TH/s at 5,360 W, or 16.0 J/TH. That is a different cooling loop and a different machine rather than the same ASIC in a tank, but it shows the order of the J/TH gain from changing the medium: around 9%.
What to measure after a tune
Miner telemetry reports estimated power. The bill is for wall power. Judging the gain by the number in the web interface is a comfortable way to fool yourself.
- Wall power with a plug-in meter, after the machine has warmed up, not in the first minutes. It is the only figure you actually pay for.
- Pool-side hashrate over 24 hours, not the local reading. The local one knows nothing about rejected shares.
- Reject and stale share before and after, against your pool's own published range from the table above.
- Board temperatures and, if the firmware exposes it, the hardware error counter.
- Payouts over 7 days, not over one day. On PPLNS, and far more so on solo, a single day proves nothing.
- The marginal efficiency of what you gave up: watts saved divided by terahashes lost, compared against the threshold. That is the answer to whether it was worth doing.
The 7-day point is not a formality. Difficulty retargets every 2016 blocks, roughly every two weeks, so if your before and after sit on opposite sides of a retarget you are no longer measuring the tune. Plan the comparison inside one epoch.
When tuning is not worth doing
There are more of these cases than people expect.
- Power at $0.03/kWh or below. The 53.42 W/TH threshold sits above the efficiency of almost any live hardware, so every terahash you shed is a straight loss.
- An old machine already at the edge. Tuning moves the break-even point; it does not make a machine profitable when it is deep underwater. Nothing rescues an Antminer S9 at 98 J/TH.
- Hosting billed on contracted capacity rather than metered consumption. You hand back hashrate and get nothing except a lighter duty cycle.
- A machine under warranty you actually intend to use. That trade is calculated separately and often does not favour tuning.
- While pool connectivity is flaky there is nothing to tune: a before-and-after in that state measures the link, not the profile.
- Immersion bought for the sake of tuning alone. The capex is justified by other things; watt savings are rarely the main one.
One case people forget: heating. If the ASIC displaces electric space heating in winter, part of its consumption comes back to you as heat, the effective price per kilowatt-hour drops, and the threshold in the table shifts down for you, taking the case for tuning with it.
Common questions about ASIC undervolting and J/TH efficiency
How much hashrate does undervolting cost
It depends on the model, the silicon lottery and how deep the profile goes, and no single figure exists. What matters is not the hashrate loss itself but its price: watts saved divided by terahashes lost. If that ratio is above your W/TH threshold, the hashrate loss pays for itself in electricity. LuxOS publishes concrete pairs. On an Antminer S21 Pro rated at 234 TH/s and 3,510 W, the Balanced profile gives 230.0 TH/s at 3,293 W, which is 1.7% less hashrate against 6.2% less power, while underclock step -4 gives 199.8 TH/s at 2,525 W, 14.6% against 28.1%. The marginal efficiency of the slice dropped is 54.3 W/TH in the first case and 28.8 W/TH in the second: at a hashprice of $39.25 per PH/s per day the first profile already pays from a tariff of about $0.030 per kWh, the second from about $0.056.
Does undervolting damage an ASIC
Lower voltage and frequency reduce thermal load, which generally works in the hardware's favour rather than against it. The risk sits elsewhere: warranty loss when firmware is replaced, and instability in an over-aggressive profile, which shows up as a rising share of bad shares. The official wording as of 21.09.2026: Bitmain refuses warranty on "unauthorized changes on firmware or hardware using any third party's product(s)", Canaan if "the product has been modified or has non-official firmware installed", and MicroBT lists "use of non-approved or unofficial software" and overclocking damage among its exclusions. Bitmain and MicroBT formally require damage to have been caused; at Canaan the act of installing is enough.
Is it better to buy an efficient machine or tune an old one
If your tariff is above the old machine's break-even price, tuning only slows the loss while a purchase changes the sign. Revenue per megawatt-hour by efficiency class gives the reference: $133 for fleets under 14 J/TH against $50 for 25-38 J/TH on the Hashrate Index reading of 14.09.2026. That 2.66x on the same megawatt-hour is what an upgrade actually buys. Model-by-model efficiency and net income sit in the ASIC ranking.
The short version
Undervolting is neither an upgrade nor a downgrade. It is a trade: you give up the last terahashes and get watts back. One comparison decides whether the trade is good, the marginal efficiency of the discarded slice against the threshold R divided by 0.024 times C. Everything else, pool fee and payout scheme included, moves the result by single-digit percentages.
The threshold takes a minute to calculate and changes every two weeks along with difficulty and hashprice. Run it before you open the settings. For half the readers on cheap power the answer will be "leave it alone", and that is a result too.
This article contains referral links to mining pools (marked as sponsored). We may receive a reward if you register through them. This does not change the figures or the order of rows in the tables: the terms are taken from the pools' official pages.